Copyright
©The Author(s) 2017.
World J Gastroenterol. Feb 21, 2017; 23(7): 1289-1297
Published online Feb 21, 2017. doi: 10.3748/wjg.v23.i7.1289
Published online Feb 21, 2017. doi: 10.3748/wjg.v23.i7.1289
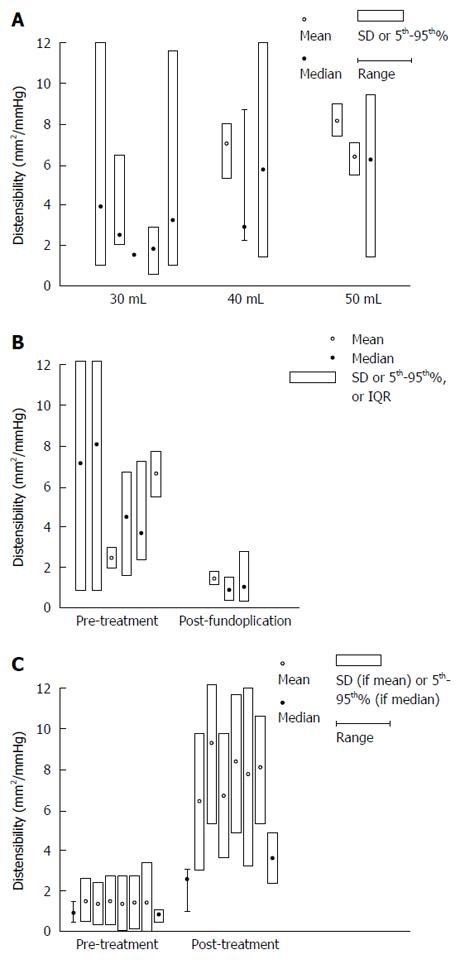
Figure 2 Healthy subjects.
A: Mean values (open circles) with standard deviations (vertical boxes around means) and median values (closed circles) with 5th to 95th percentile (vertical boxes around medians), and ranges (vertical lines) for distensibility (mm2/mmHg) at FLIP bag volume of 30, 40, and 50 mL in healthy volunteers are shown in this plot; B: Mean values (open circles) with standard deviations (vertical boxes around means) and median values (closed circles) with 5th to 95th percentile (vertical boxes around medians), and ranges (vertical lines) for distensibility (mm2/mmHg) in GERD subjects before and after fundoplication are shown in this plot; C: Mean values (open circles) with standard deviations (vertical boxes around means) and median values (closed circles) with 5th to 95th percentile (vertical boxes around medians), and ranges (vertical lines) for distensibility (mm2/mmHg) in achalasia patients pre- and post-treatment using balloon length 7-10 cm at 40 mL bag volume are shown in this plot. The increase in EGJ distensibility post-achalasia treatment is illustrated here.
- Citation: Chen JW, Rubenstein JH. Esophagogastric junction distensibility assessed using the functional lumen imaging probe. World J Gastroenterol 2017; 23(7): 1289-1297
- URL: https://www.wjgnet.com/1007-9327/full/v23/i7/1289.htm
- DOI: https://dx.doi.org/10.3748/wjg.v23.i7.1289


