Copyright
©The Author(s) 2017.
World J Gastroenterol. Feb 21, 2017; 23(7): 1268-1277
Published online Feb 21, 2017. doi: 10.3748/wjg.v23.i7.1268
Published online Feb 21, 2017. doi: 10.3748/wjg.v23.i7.1268
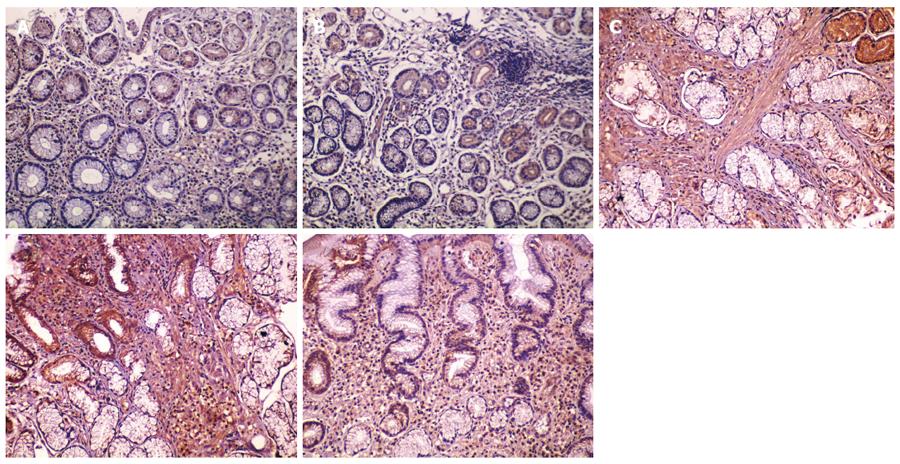
Figure 6 Expression of TGF-β1 was analyzed using immunohistochemical staining in a 200 × field.
Yellow-stained signals in the cytoplasm and (or) cell membrane represent positive cells. A: Results of combination therapy before and after treatment; B: Results of monotherapy before and after treatment; C: Results in the healthy control group. The expression of TGF-β1 in the combination therapy group was significantly higher than that in the monotherapy group, and similar to that in the healthy control group.
- Citation: Yang RQ, Mao H, Huang LY, Su PZ, Lu M. Effects of hydrotalcite combined with esomeprazole on gastric ulcer healing quality: A clinical observation study. World J Gastroenterol 2017; 23(7): 1268-1277
- URL: https://www.wjgnet.com/1007-9327/full/v23/i7/1268.htm
- DOI: https://dx.doi.org/10.3748/wjg.v23.i7.1268


