Copyright
©The Author(s) 2017.
World J Gastroenterol. Feb 21, 2017; 23(7): 1250-1261
Published online Feb 21, 2017. doi: 10.3748/wjg.v23.i7.1250
Published online Feb 21, 2017. doi: 10.3748/wjg.v23.i7.1250
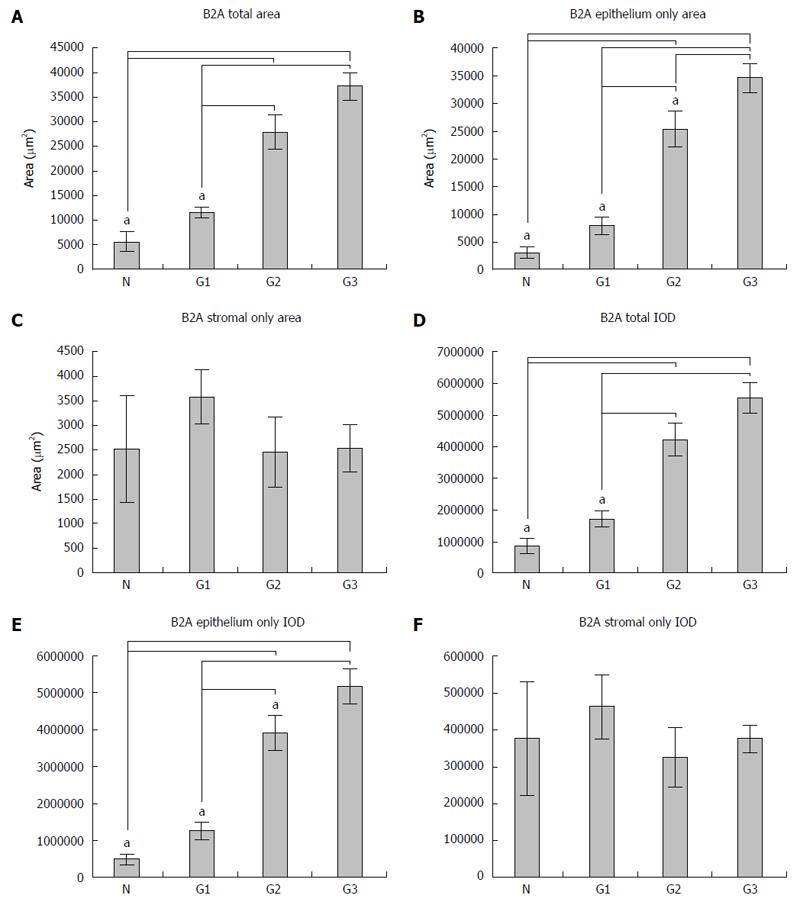
Figure 4 Analysis of the expression of beta-2 adrenergic receptors.
Total expression area increases gradually from normal tissue to G1, G2 and G3 differentiated adenocarcinoma (A), and this differentiation is driven by the expression in the epithelial areas (B), where assessing stromal signal revealed no differences (C). The same scenario is obtained when evaluating the integrated optical density (IOD) of the signal (D-F). aP < 0.05 represents statistical significance on one-way analysis of variance with post hoc comparisons using the Bonferroni’s test. Error bars represent standard errors of the mean. B2A: Beta-2 adrenergic.
- Citation: Ciurea RN, Rogoveanu I, Pirici D, Târtea GC, Streba CT, Florescu C, Cătălin B, Puiu I, Târtea EA, Vere CC. B2 adrenergic receptors and morphological changes of the enteric nervous system in colorectal adenocarcinoma. World J Gastroenterol 2017; 23(7): 1250-1261
- URL: https://www.wjgnet.com/1007-9327/full/v23/i7/1250.htm
- DOI: https://dx.doi.org/10.3748/wjg.v23.i7.1250


