Copyright
©The Author(s) 2017.
World J Gastroenterol. Feb 21, 2017; 23(7): 1250-1261
Published online Feb 21, 2017. doi: 10.3748/wjg.v23.i7.1250
Published online Feb 21, 2017. doi: 10.3748/wjg.v23.i7.1250
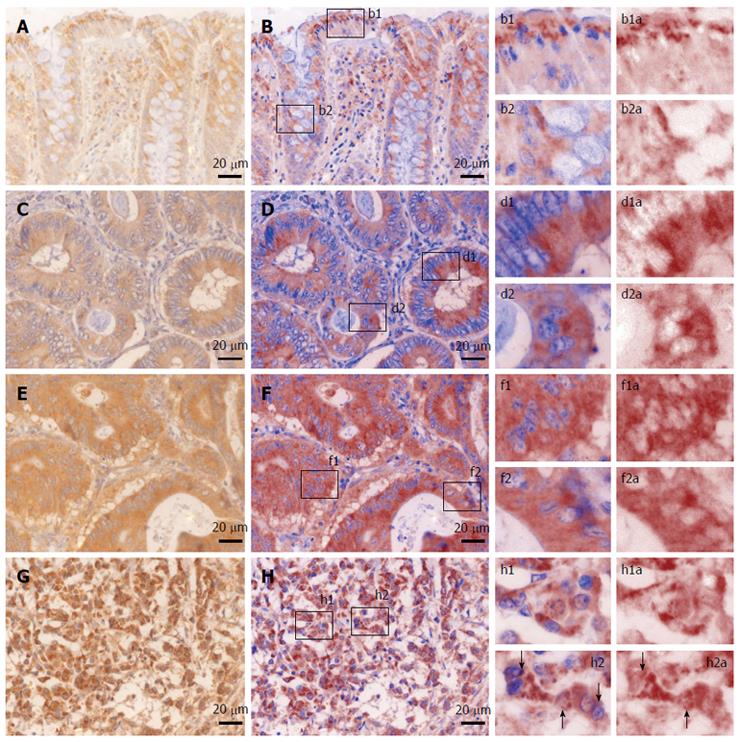
Figure 2 Analysis of the expression of beta-2 adrenergic receptors in the normal and tumor colon tissue.
RGB (A) and unmixed (B; b1, b1a; b2, b2a) images showing receptor presence mostly as dense granules in the supranuclear sector of the superficial layer of enterocytes (b1; b1a), as well as in the sub-nuclear region of the glandular cells of the crypts (b2; b2a). In well differentiated adenocarcinoma, RGB (C) and unmixed images (D; d1, d1a; d2, d2a) revealed a more dense-diffuse like pattern of expression mostly in the apical sector of the cells (d, d1a), but also in the basal pole of the cells (d2, d2a). In moderately differentiated adenocarcinoma, RGB (E) and unmixed images (F; f1, f1a; f2, f2a) revealed an ever denser and more uniform expression pattern in all the cytoplasm of the tumor cells. In poorly differentiated adenocarcinomas, RGB (G) and unmixed images (H; h1, h1a; h2, h2a) reveal an even denser granular expression pattern, with occasional intra(peri) nuclear localization (arrows in h2 and h2a). Small letters represent enlarged insets from the capital lettered images.
- Citation: Ciurea RN, Rogoveanu I, Pirici D, Târtea GC, Streba CT, Florescu C, Cătălin B, Puiu I, Târtea EA, Vere CC. B2 adrenergic receptors and morphological changes of the enteric nervous system in colorectal adenocarcinoma. World J Gastroenterol 2017; 23(7): 1250-1261
- URL: https://www.wjgnet.com/1007-9327/full/v23/i7/1250.htm
- DOI: https://dx.doi.org/10.3748/wjg.v23.i7.1250


