Copyright
©The Author(s) 2017.
World J Gastroenterol. Feb 21, 2017; 23(7): 1189-1202
Published online Feb 21, 2017. doi: 10.3748/wjg.v23.i7.1189
Published online Feb 21, 2017. doi: 10.3748/wjg.v23.i7.1189
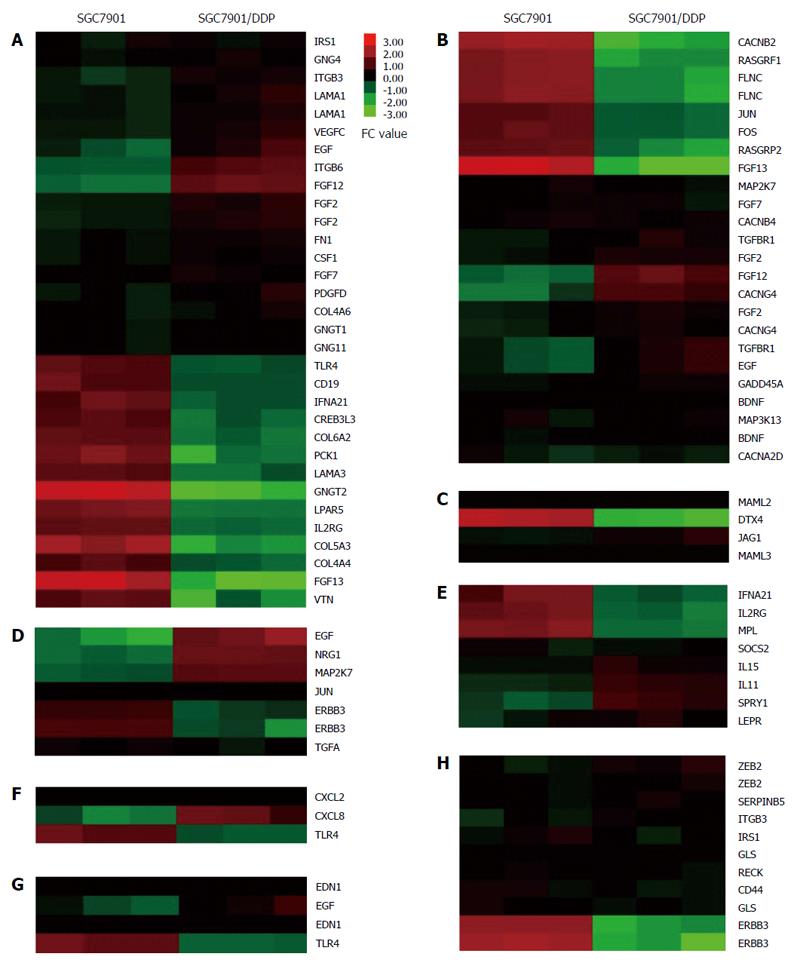
Figure 5 Heat-map of gene ontology enriched cisplatin resistance pathways and input mRNAs which significantly altered in SGC7901/DDP cells compared with SGC7901 cells.
A: PI3K-Akt signaling pathway and input genes; B: MAPK signaling pathway and input genes; C: Notch signaling pathway and input genes; D: ErbB signaling pathway and input genes; E: Jak-STAT signaling pathway and input genes; F: NF-kappa B signaling pathway and input genes; G: HIF-1 signaling pathway and input genes; H: MicroRNAs in cancer and input genes. Each row represents an mRNA, and each column represents a sample. The intensity of the color indicates the relative levels of mRNAs. Red: Higher expression levels; green: Lower expression levels. The name of the input mRNAs which significantly altered (P < 0.05, FC ≥ 2) is present at the right of the figure.
- Citation: Xie XQ, Zhao QH, Wang H, Gu KS. Dysregulation of mRNA profile in cisplatin-resistant gastric cancer cell line SGC7901. World J Gastroenterol 2017; 23(7): 1189-1202
- URL: https://www.wjgnet.com/1007-9327/full/v23/i7/1189.htm
- DOI: https://dx.doi.org/10.3748/wjg.v23.i7.1189


