Copyright
©The Author(s) 2017.
World J Gastroenterol. Feb 7, 2017; 23(5): 830-841
Published online Feb 7, 2017. doi: 10.3748/wjg.v23.i5.830
Published online Feb 7, 2017. doi: 10.3748/wjg.v23.i5.830
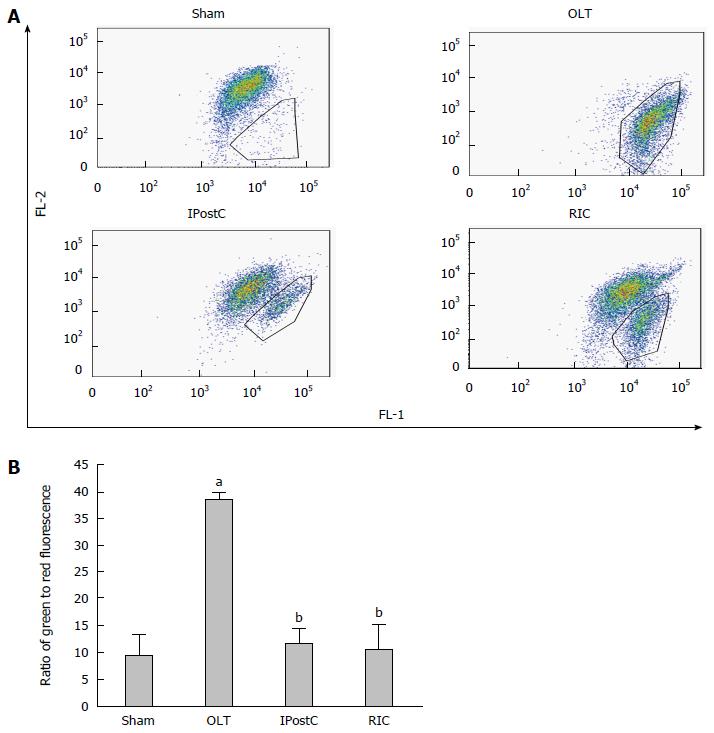
Figure 5 Effects of remote ischemic perconditioning on ΔΨm.
A: Typical dot plot analysis of JC-1 of Δm. A dot plot of red fluorescence (FL2) vs green fluorescence (FL1) resolved live liver cells with intact ΔΨm (Sham group) from apoptotic and dead cells with lost ΔΨm (OLT group); B: The change of Δm was reported by the ratio of green to red fluorescence. Data represent mean ± SEM for 5 animals per group. aP < 0.05 vs sham group; bP < 0.05 vs OLT group. OLT: Orthotopic liver transplantation.
- Citation: He N, Jia JJ, Li JH, Zhou YF, Lin BY, Peng YF, Chen JJ, Chen TC, Tong RL, Jiang L, Xie HY, Zhou L, Zheng SS. Remote ischemic perconditioning prevents liver transplantation-induced ischemia/reperfusion injury in rats: Role of ROS/RNS and eNOS. World J Gastroenterol 2017; 23(5): 830-841
- URL: https://www.wjgnet.com/1007-9327/full/v23/i5/830.htm
- DOI: https://dx.doi.org/10.3748/wjg.v23.i5.830


