Copyright
©The Author(s) 2017.
World J Gastroenterol. Dec 28, 2017; 23(48): 8500-8511
Published online Dec 28, 2017. doi: 10.3748/wjg.v23.i48.8500
Published online Dec 28, 2017. doi: 10.3748/wjg.v23.i48.8500
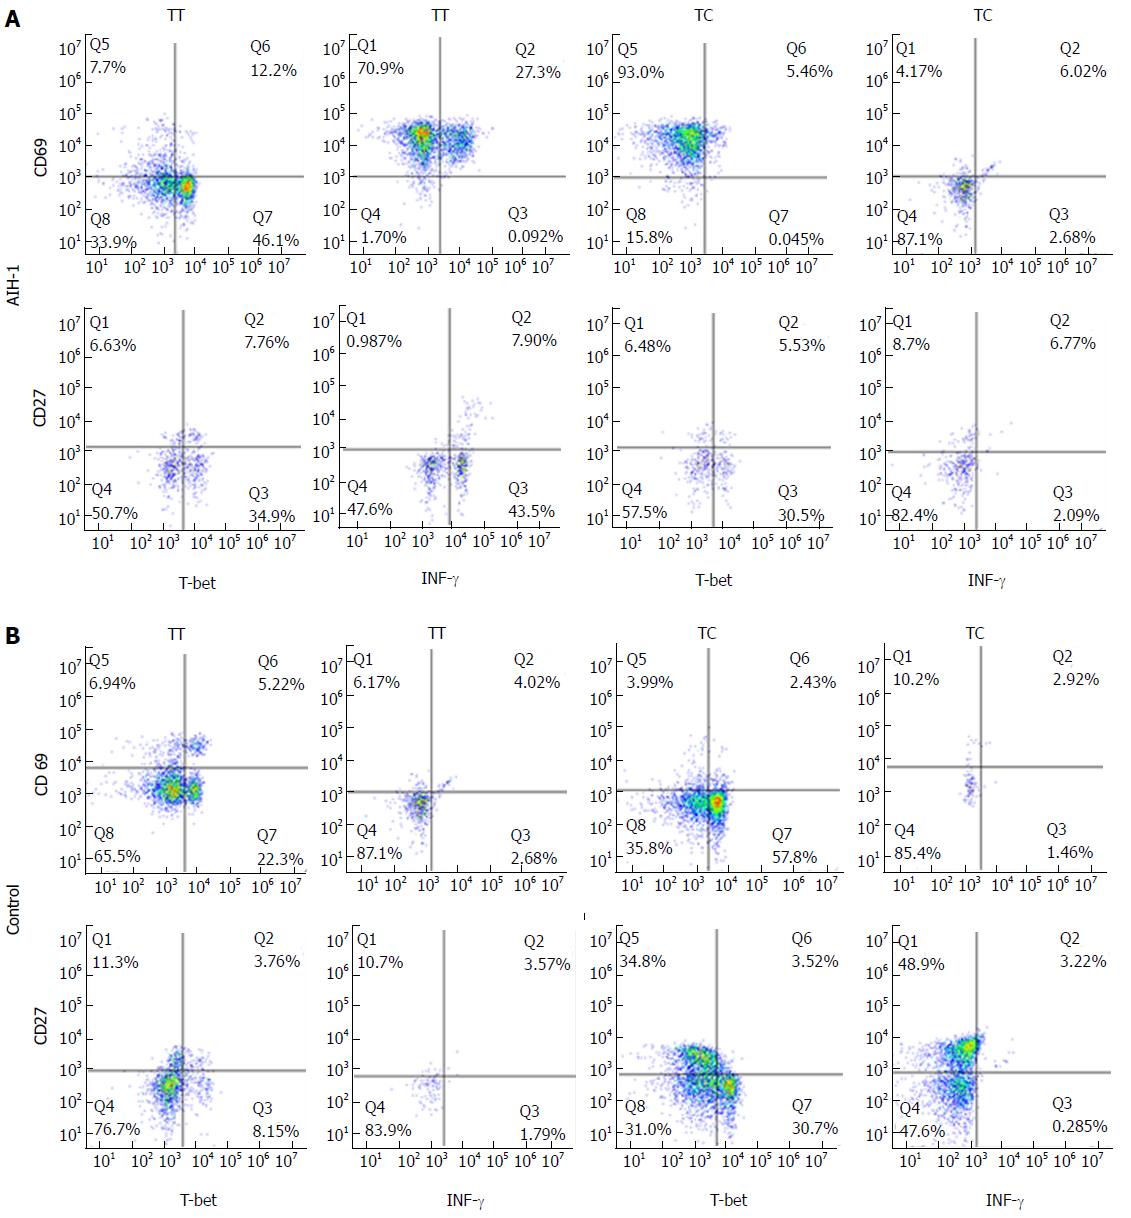
Figure 4 Representative two-parameter dot plots showing only the cells gated for CD4+ T and CD20+ B cells from the peripheral bloods of individuals carrying the TBX21-1993TC and -1993TT genotypes.
The y-axis of each histogram represents the specific fluorescence of extracellular CD69-phycoerythrin (PE) (T lymphocytes) and CD27-PE (B lymphocytes). The x-axis represents the specific fluorescence of Alexa-Flour 647-T-bet, FITC-IFNγ, or Cy5.5-IFN-γ on four-decade logarithmic scales. The quadrants were assigned using appropriate isotype controls for each intra- and extracellular antibody. A: AIH-1 patients; B: Healthy controls.
- Citation: Sun W, Wu HY, Chen S. Influence of TBX21 T-1993C variant on autoimmune hepatitis development by Yin-Yang 1 binding. World J Gastroenterol 2017; 23(48): 8500-8511
- URL: https://www.wjgnet.com/1007-9327/full/v23/i48/8500.htm
- DOI: https://dx.doi.org/10.3748/wjg.v23.i48.8500


