Copyright
©The Author(s) 2017.
World J Gastroenterol. Dec 21, 2017; 23(47): 8355-8366
Published online Dec 21, 2017. doi: 10.3748/wjg.v23.i47.8355
Published online Dec 21, 2017. doi: 10.3748/wjg.v23.i47.8355
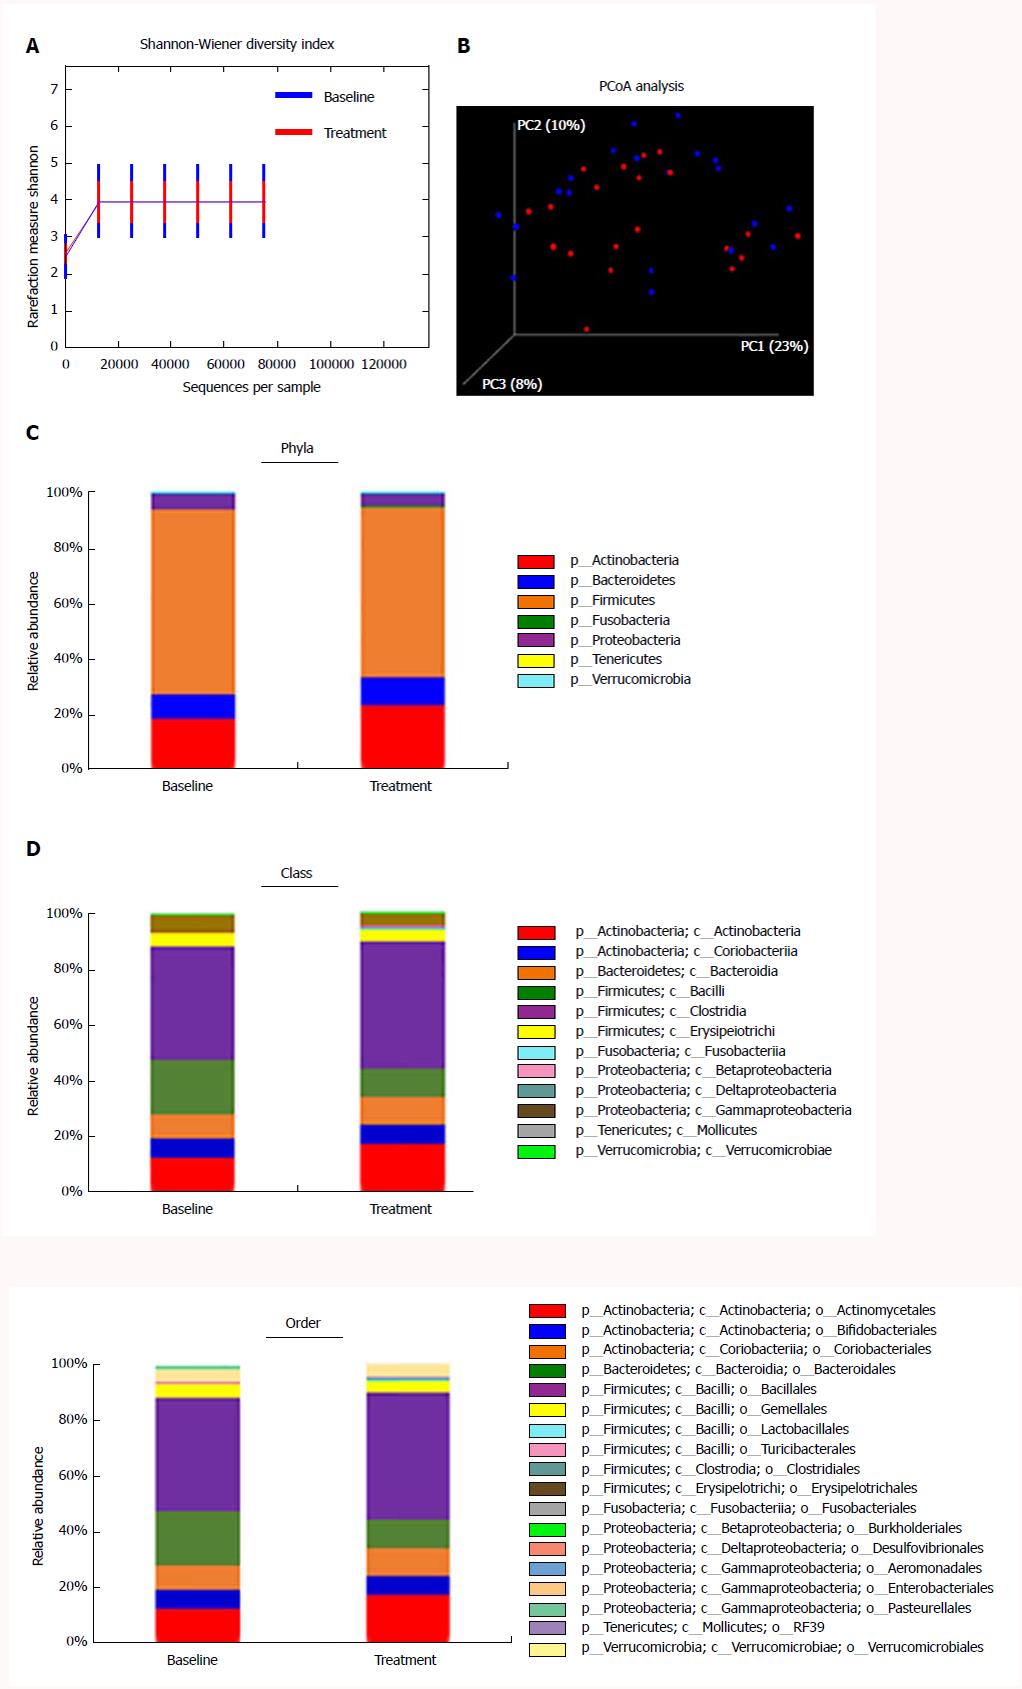
Figure 5 Effect of rifaximin on the diversity and major compositions of gut microbiome.
A: Shannon diversity between baseline and treatment groups (mean index ± SD 3.948 ± 0.548 at baseline vs 3.980 ± 0.968 at treatment, P = 0.544). B: Pco analysis (PcoA) of gut microbiota. Baseline samples (blue) were clustered together compared to 4 wk post-rifaximin (red). C-E: Effects of rifaximin on alterations in the composition of gut microbiome in phylum (C), class (D) and order (E).
- Citation: Kaji K, Takaya H, Saikawa S, Furukawa M, Sato S, Kawaratani H, Kitade M, Moriya K, Namisaki T, Akahane T, Mitoro A, Yoshiji H. Rifaximin ameliorates hepatic encephalopathy and endotoxemia without affecting the gut microbiome diversity. World J Gastroenterol 2017; 23(47): 8355-8366
- URL: https://www.wjgnet.com/1007-9327/full/v23/i47/8355.htm
- DOI: https://dx.doi.org/10.3748/wjg.v23.i47.8355


