Copyright
©The Author(s) 2017.
World J Gastroenterol. Dec 21, 2017; 23(47): 8334-8344
Published online Dec 21, 2017. doi: 10.3748/wjg.v23.i47.8334
Published online Dec 21, 2017. doi: 10.3748/wjg.v23.i47.8334
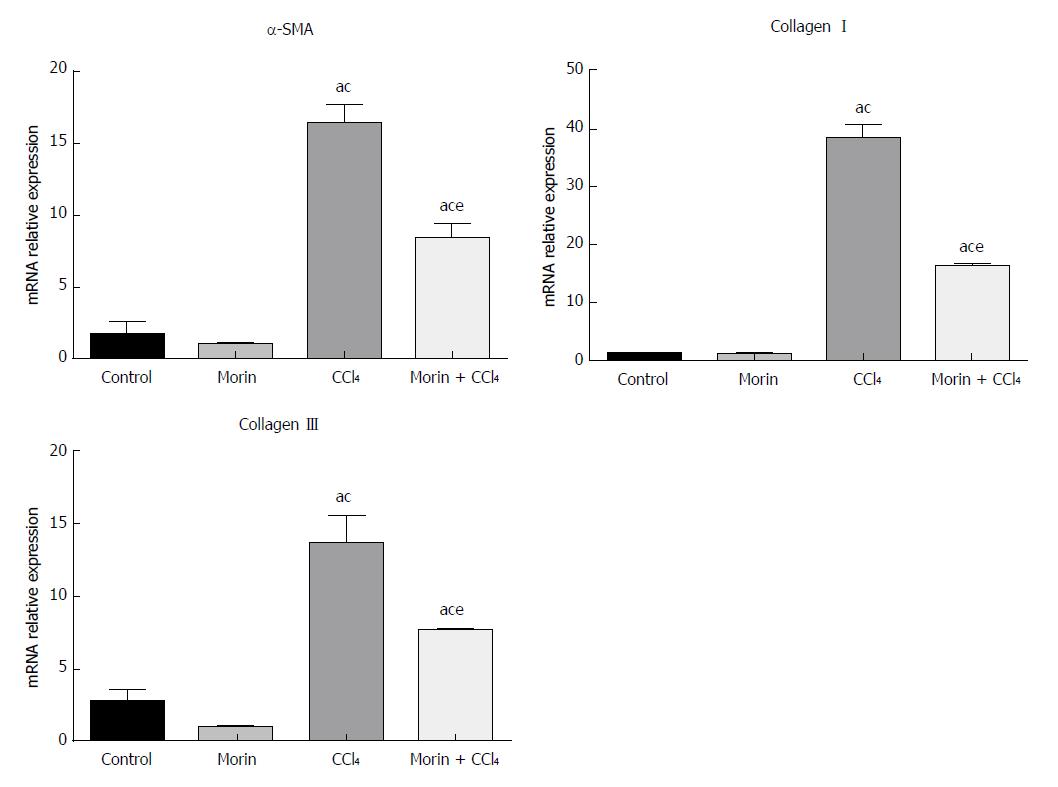
Figure 4 The mRNA expression of α-SMA, collagen I, and collagen III.
aP < 0.05 vs control group, cP < 0.05 vs morin group, eP < 0.05 vs CCl4 group. In the control and morin groups, there was only minimal expression. The CCl4 and morin + CCl4 groups showed significantly increased expression (P < 0.05), while the expression levels in the morin + CCl4 group were lower than those of the CCl4 group (P < 0.05).
- Citation: Sang L, Wang XM, Xu DY, Sang LX, Han Y, Jiang LY. Morin enhances hepatic Nrf2 expression in a liver fibrosis rat model. World J Gastroenterol 2017; 23(47): 8334-8344
- URL: https://www.wjgnet.com/1007-9327/full/v23/i47/8334.htm
- DOI: https://dx.doi.org/10.3748/wjg.v23.i47.8334


