Copyright
©The Author(s) 2017.
World J Gastroenterol. Dec 21, 2017; 23(47): 8334-8344
Published online Dec 21, 2017. doi: 10.3748/wjg.v23.i47.8334
Published online Dec 21, 2017. doi: 10.3748/wjg.v23.i47.8334
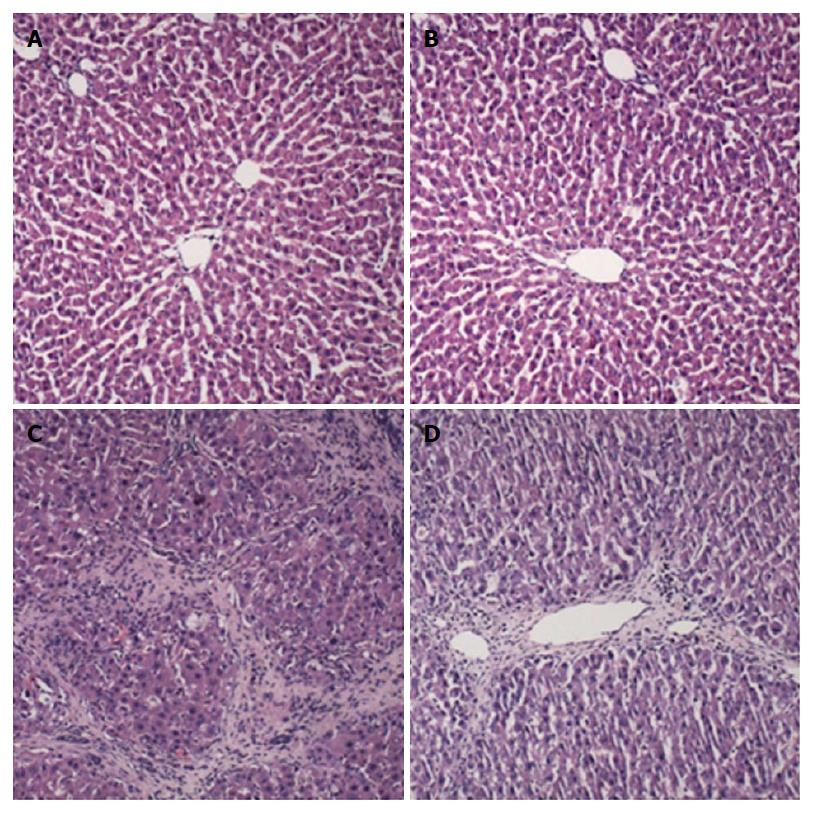
Figure 3 Histological changes of liver samples.
A: Control group: treated with vehicle only; B: Morin group: treated with morin at a dose of 50 mg/kg twice a week; C: CCl4 group: injected with CCl4 at a dose of 2 mL/kg twice a week; D: Morin + CCl4 group: treated with the same volume of morin and CCl4 as the morin and CCl4 groups. Liver tissues were stained with H&E (× 100).
- Citation: Sang L, Wang XM, Xu DY, Sang LX, Han Y, Jiang LY. Morin enhances hepatic Nrf2 expression in a liver fibrosis rat model. World J Gastroenterol 2017; 23(47): 8334-8344
- URL: https://www.wjgnet.com/1007-9327/full/v23/i47/8334.htm
- DOI: https://dx.doi.org/10.3748/wjg.v23.i47.8334


