Copyright
©The Author(s) 2017.
World J Gastroenterol. Dec 7, 2017; 23(45): 8062-8072
Published online Dec 7, 2017. doi: 10.3748/wjg.v23.i45.8062
Published online Dec 7, 2017. doi: 10.3748/wjg.v23.i45.8062
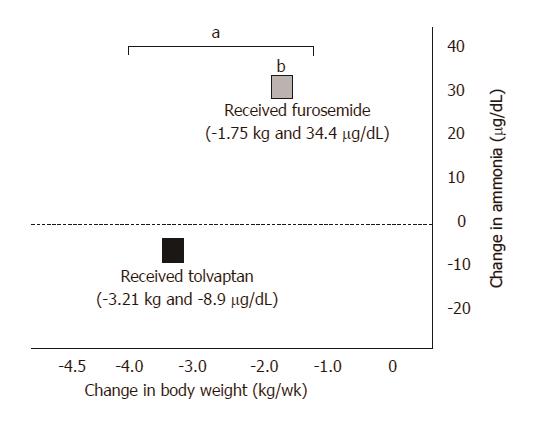
Figure 8 Changes in ammonia and body weight from baseline after administration of drugs.
Comparisons between final values and baseline values for each group were performed using the Wilcoxon signed-rank test, bP < 0.01. Comparisons between the groups were performed using the Mann-Whitney U test, aP < 0.05.
- Citation: Uojima H, Hidaka H, Nakayama T, Sung JH, Ichita C, Tokoro S, Masuda S, Sasaki A, Koizumi K, Egashira H, Kako M. Efficacy of combination therapy with natriuretic and aquaretic drugs in cirrhotic ascites patients: A randomized study. World J Gastroenterol 2017; 23(45): 8062-8072
- URL: https://www.wjgnet.com/1007-9327/full/v23/i45/8062.htm
- DOI: https://dx.doi.org/10.3748/wjg.v23.i45.8062


