Copyright
©The Author(s) 2017.
World J Gastroenterol. Dec 7, 2017; 23(45): 7978-7988
Published online Dec 7, 2017. doi: 10.3748/wjg.v23.i45.7978
Published online Dec 7, 2017. doi: 10.3748/wjg.v23.i45.7978
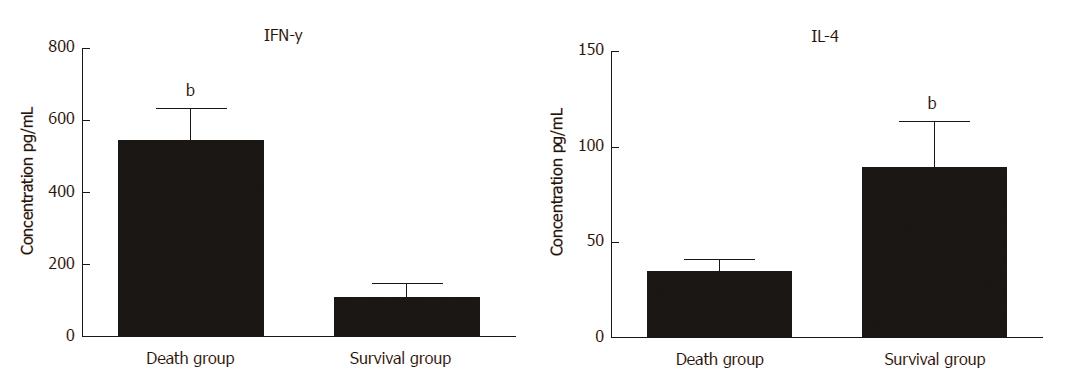
Figure 6 Flow cytometry analysis for serum levels of IFN-y and IL-4 in survival and death groups after mesenchymal stem cell treatment.
Bar represents the mean ± SD (n = 6, bP < 0.001).
- Citation: Li YW, Zhang C, Sheng QJ, Bai H, Ding Y, Dou XG. Mesenchymal stem cells rescue acute hepatic failure by polarizing M2 macrophages. World J Gastroenterol 2017; 23(45): 7978-7988
- URL: https://www.wjgnet.com/1007-9327/full/v23/i45/7978.htm
- DOI: https://dx.doi.org/10.3748/wjg.v23.i45.7978


