Copyright
©The Author(s) 2017.
World J Gastroenterol. Dec 7, 2017; 23(45): 7978-7988
Published online Dec 7, 2017. doi: 10.3748/wjg.v23.i45.7978
Published online Dec 7, 2017. doi: 10.3748/wjg.v23.i45.7978
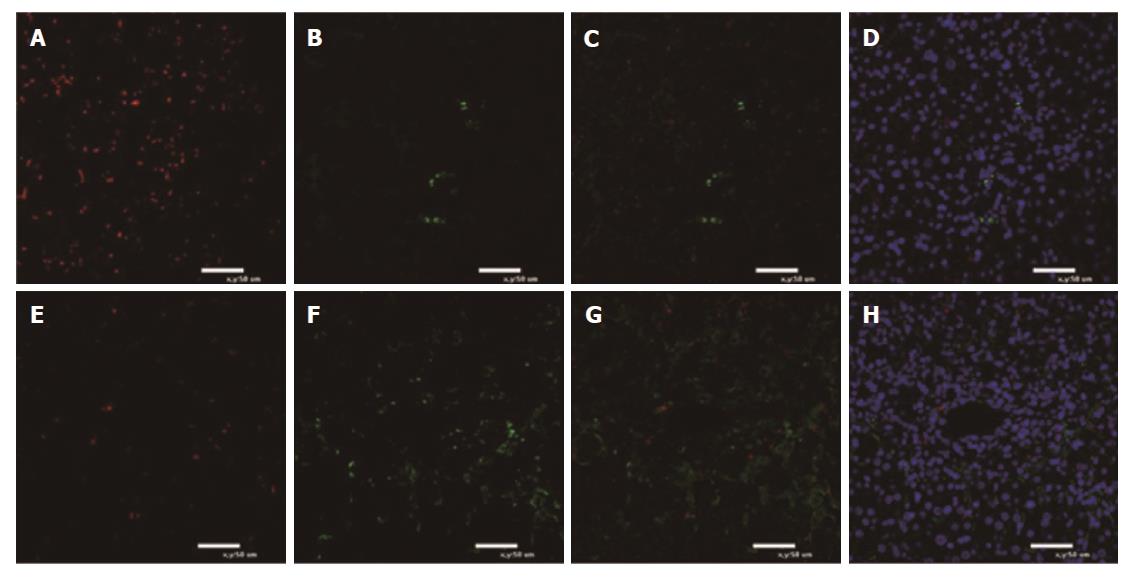
Figure 5 Immunofluorescence for polarization of macrophages in liver tissue.
A-D: Death group after mesenchymal stem cell (MSC) treatment; E-H: Survival group after MSC treatment. Green fluorescence indicates CD163+ macrophages. Red fluorescence indicates CD68+ macrophages. Nuclei are stained blue with DAPI. Immunofluorescence for M1 macrophages reacting to CD68 and M2 macrophages reacting to CD163 is shown (n = 5).
- Citation: Li YW, Zhang C, Sheng QJ, Bai H, Ding Y, Dou XG. Mesenchymal stem cells rescue acute hepatic failure by polarizing M2 macrophages. World J Gastroenterol 2017; 23(45): 7978-7988
- URL: https://www.wjgnet.com/1007-9327/full/v23/i45/7978.htm
- DOI: https://dx.doi.org/10.3748/wjg.v23.i45.7978


