Copyright
©The Author(s) 2017.
World J Gastroenterol. Nov 28, 2017; 23(44): 7849-7862
Published online Nov 28, 2017. doi: 10.3748/wjg.v23.i44.7849
Published online Nov 28, 2017. doi: 10.3748/wjg.v23.i44.7849
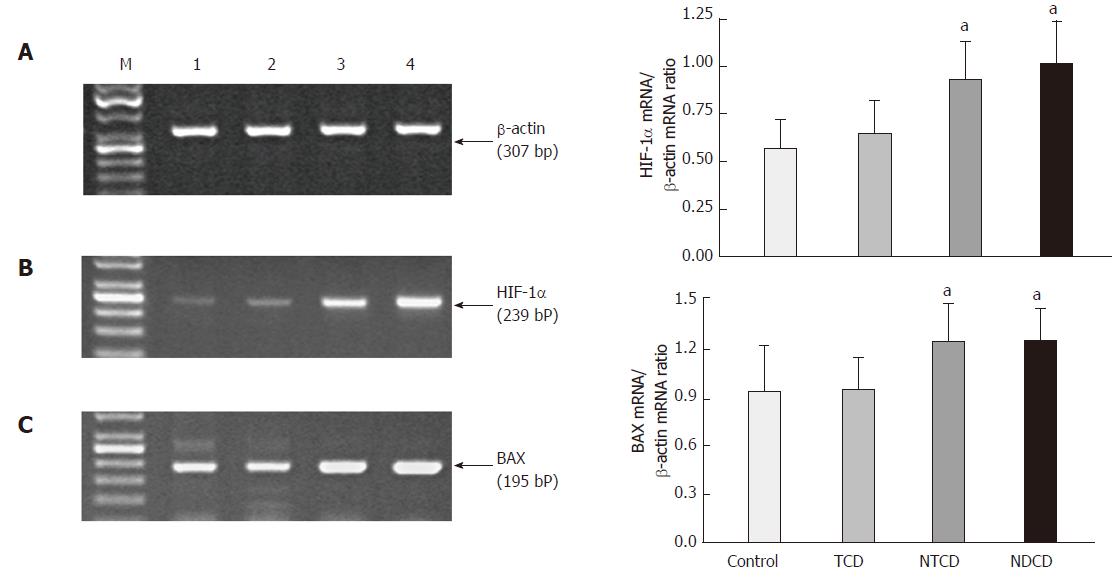
Figure 4 The RT-PCR expression of mRNA for β-actin (A), hypoxia-inducible factor 1α (B) and BAX (C) in duodenal tissue of celiac patients and controls.
The band densities [as a ratio of hypoxia-inducible factor 1α (HIF-1α) and BAX to the β-actin levels, respectively] are expressed as the mean ± SE of 4 determinations in selected patients. TCD: Treated celiac group; NTCD: Nontreated celiac group; NDCD: Newly diagnosed celiac group. aP < 0.05 vs control and treated CD groups.
- Citation: Piatek-Guziewicz A, Ptak-Belowska A, Przybylska-Felus M, Pasko P, Zagrodzki P, Brzozowski T, Mach T, Zwolinska-Wcislo M. Intestinal parameters of oxidative imbalance in celiac adults with extraintestinal manifestations. World J Gastroenterol 2017; 23(44): 7849-7862
- URL: https://www.wjgnet.com/1007-9327/full/v23/i44/7849.htm
- DOI: https://dx.doi.org/10.3748/wjg.v23.i44.7849


