Copyright
©The Author(s) 2017.
World J Gastroenterol. Nov 28, 2017; 23(44): 7818-7829
Published online Nov 28, 2017. doi: 10.3748/wjg.v23.i44.7818
Published online Nov 28, 2017. doi: 10.3748/wjg.v23.i44.7818
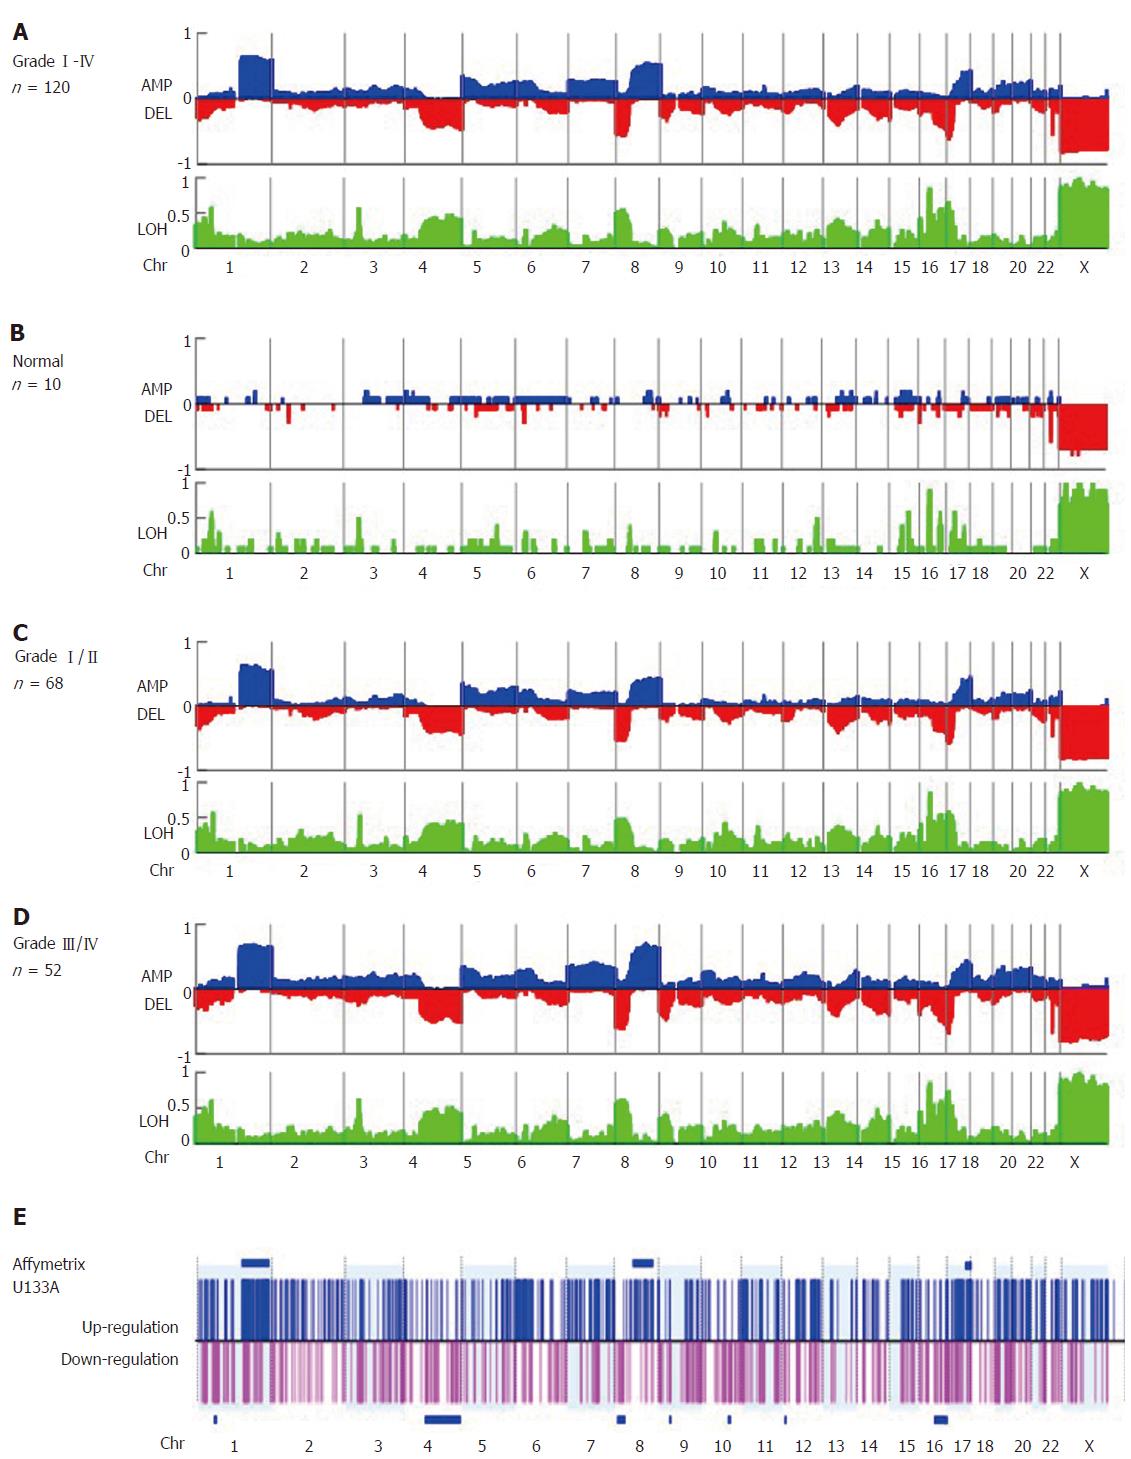
Figure 1 Virtual karyotyping analysis of amplification, deletion, and loss of heterozygosity in 120 formalin fixed, paraffin-embedded specimens of early-stage hepatocellular carcinoma.
The frequency of copy number amplification (AMP), deletion (DEL), and loss of heterozygosity (LOH) in (A) specimens from all 120 patients with hepatocellular carcinoma (HCC), (B) patients with benign liver lesions (n = 10), (C) Edmonson grade I/II HCC specimens (n = 68), and (D) Edmonson grade III/IV HCC specimens (n = 52) are shown on the Y-axis of each panel. Relative chromosomal position is shown on the X-axis. Blue and red plots represent the frequency of copy number amplification and deletion, respectively (upper panel), and LOH (shown in green, lower panel). Note that +1, 0, and -1 represent a frequency of 100% amplification, no alteration, and 100% deletion, respectively. (E) The gene expression profiles of another set of early-stage HCC tumors (n = 40). The log ratio of each probe set was normalized by the normal counterpart of each HCC tumor [log(T-N)] and fold changes > 2 or ≤ 2 were considered up- (shown in blue) or down-regulated (shown in pink), respectively. The P-value for differential gene expression in tumor versus normal tissue was calculated and considered significant with P < 0.05. Clustered chromosome regions associated with genome change are shown as horizontal blue bars (P < 0.05).
- Citation: Yu MC, Lee CW, Lee YS, Lian JH, Tsai CL, Liu YP, Wu CH, Tsai CN. Prediction of early-stage hepatocellular carcinoma using OncoScan chromosomal copy number aberration data. World J Gastroenterol 2017; 23(44): 7818-7829
- URL: https://www.wjgnet.com/1007-9327/full/v23/i44/7818.htm
- DOI: https://dx.doi.org/10.3748/wjg.v23.i44.7818


