Copyright
©The Author(s) 2017.
World J Gastroenterol. Nov 21, 2017; 23(43): 7705-7715
Published online Nov 21, 2017. doi: 10.3748/wjg.v23.i43.7705
Published online Nov 21, 2017. doi: 10.3748/wjg.v23.i43.7705
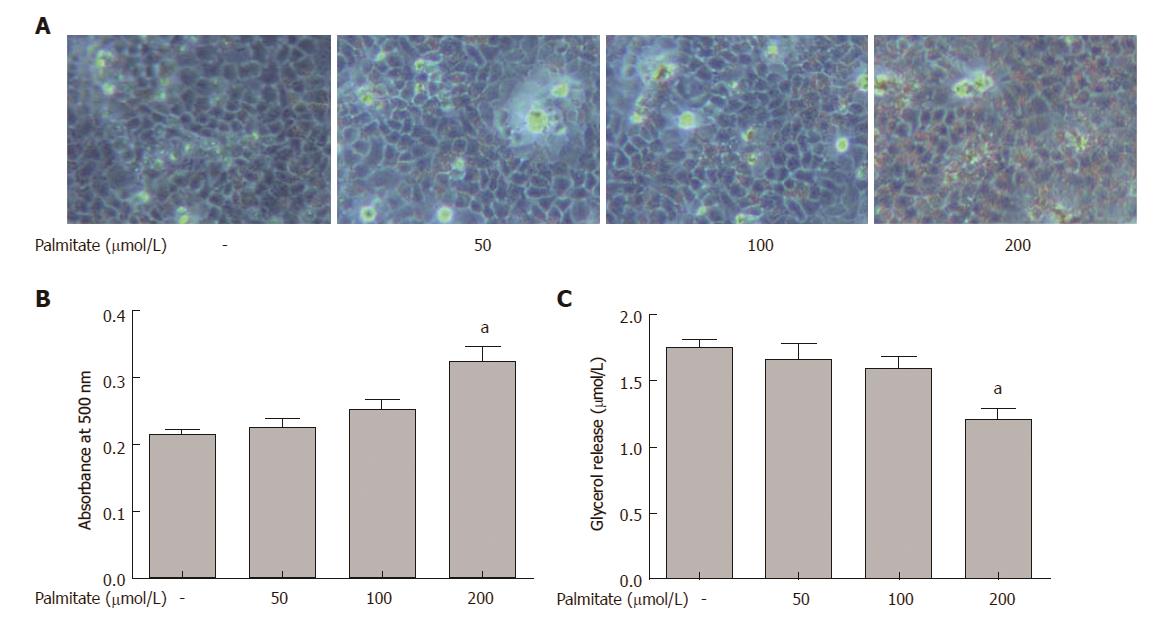
Figure 1 Palmitate-induced lipid accumulation and inhibition of lipolysis in HepG2 cells.
A and B: Dose response of lipid accumulation induced by palmitate. HepG2 cells were treated with various concentrations of palmitate for 24 h, and (A) stained with Oil Red O to visualize the intracellular lipid contents (original magnification, × 100); B: Lipid accumulation was quantified by absorbance value of the extracted Oil Red O dye at 500 nm. At least three independent experiments were conducted for each measurement. Data are presented as means ± SE. aP < 0.05 vs untreated control. C: Dose response of inhibition of lipolysis induced by palmitate. HepG2 cells were treated with various concentrations of palmitate for 24 h, and lipolysis was assessed by glycerol release into the medium. At least three independent experiments were conducted for each measurement. Data are presented as means ± SE. aP < 0.05 vs untreated control.
- Citation: Zhao NQ, Li XY, Wang L, Feng ZL, Li XF, Wen YF, Han JX. Palmitate induces fat accumulation by activating C/EBPβ-mediated G0S2 expression in HepG2 cells. World J Gastroenterol 2017; 23(43): 7705-7715
- URL: https://www.wjgnet.com/1007-9327/full/v23/i43/7705.htm
- DOI: https://dx.doi.org/10.3748/wjg.v23.i43.7705


