Copyright
©The Author(s) 2017.
World J Gastroenterol. Nov 14, 2017; 23(42): 7584-7593
Published online Nov 14, 2017. doi: 10.3748/wjg.v23.i42.7584
Published online Nov 14, 2017. doi: 10.3748/wjg.v23.i42.7584
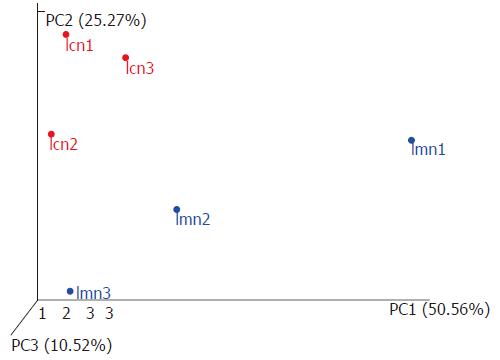
Figure 3 Three-dimensional sorting graph of samples based on weighted UniFrac principal coordinates analysis.
Each point in the figure represents a sample. Points with the same color belong to the same group. The closer the distance between two points, the smaller the difference in the microbial community. lcn1-3 were control groups 1-3, and lmn1-3 were model groups 1-3.
- Citation: Long CX, He L, Guo YF, Liu YW, Xiao NQ, Tan ZJ. Diversity of bacterial lactase genes in intestinal contents of mice with antibiotics-induced diarrhea. World J Gastroenterol 2017; 23(42): 7584-7593
- URL: https://www.wjgnet.com/1007-9327/full/v23/i42/7584.htm
- DOI: https://dx.doi.org/10.3748/wjg.v23.i42.7584


