Copyright
©The Author(s) 2017.
World J Gastroenterol. Oct 28, 2017; 23(40): 7221-7231
Published online Oct 28, 2017. doi: 10.3748/wjg.v23.i40.7221
Published online Oct 28, 2017. doi: 10.3748/wjg.v23.i40.7221
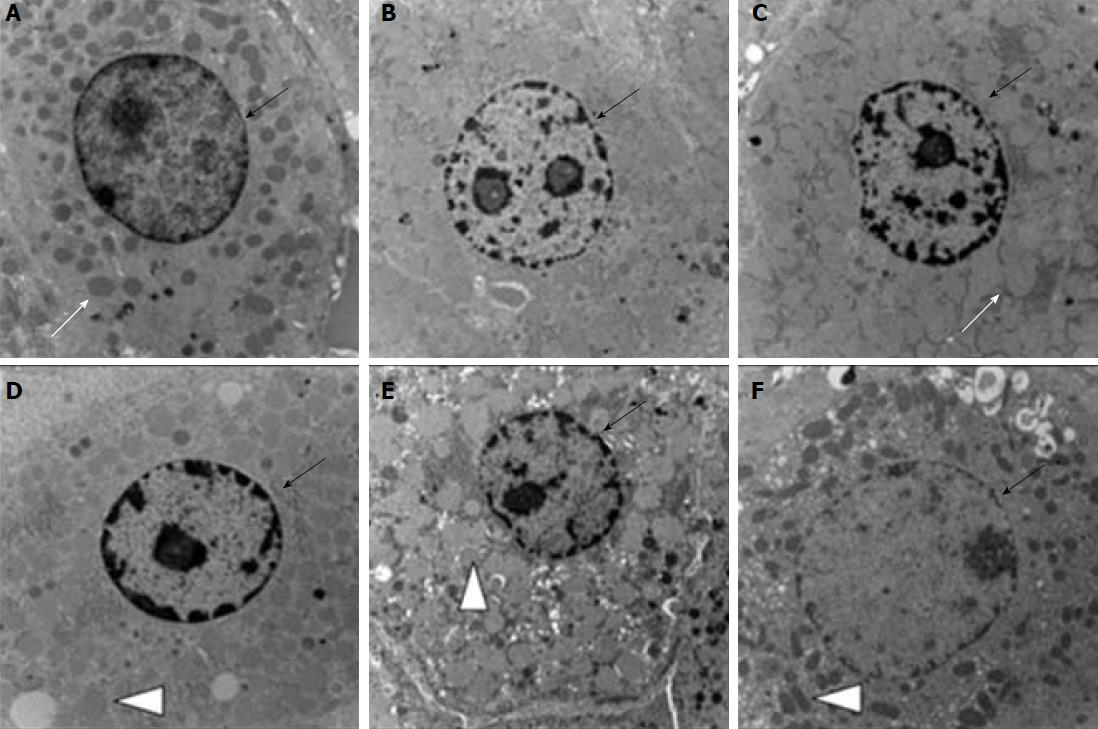
Figure 5 Ultrastructural changes of hepatocytes.
A and D: Hepatocytes of the young control group A and the aged control group D, respectively; B and E: Hepatocytes of the young group B and aged group E of UWP without metformin, respectively; C and F: Hepatocytes of the young group C and aged group F of MUWP, respectively. The black arrows indicate the nuclei, the white arrows indicate the intracellular mitochondria of the young groups, and the white triangles indicate the intracellular mitochondria of the aged groups. UWP: University of Wisconsin solution perfusion; MUWP: Metformin perfusion solution. Original magnification (A-F): ×10000.
- Citation: Chai YC, Dang GX, He HQ, Shi JH, Zhang HK, Zhang RT, Wang B, Hu LS, Lv Y. Hypothermic machine perfusion with metformin-University of Wisconsin solution for ex vivo preservation of standard and marginal liver grafts in a rat model. World J Gastroenterol 2017; 23(40): 7221-7231
- URL: https://www.wjgnet.com/1007-9327/full/v23/i40/7221.htm
- DOI: https://dx.doi.org/10.3748/wjg.v23.i40.7221


