Copyright
©The Author(s) 2017.
World J Gastroenterol. Oct 28, 2017; 23(40): 7221-7231
Published online Oct 28, 2017. doi: 10.3748/wjg.v23.i40.7221
Published online Oct 28, 2017. doi: 10.3748/wjg.v23.i40.7221
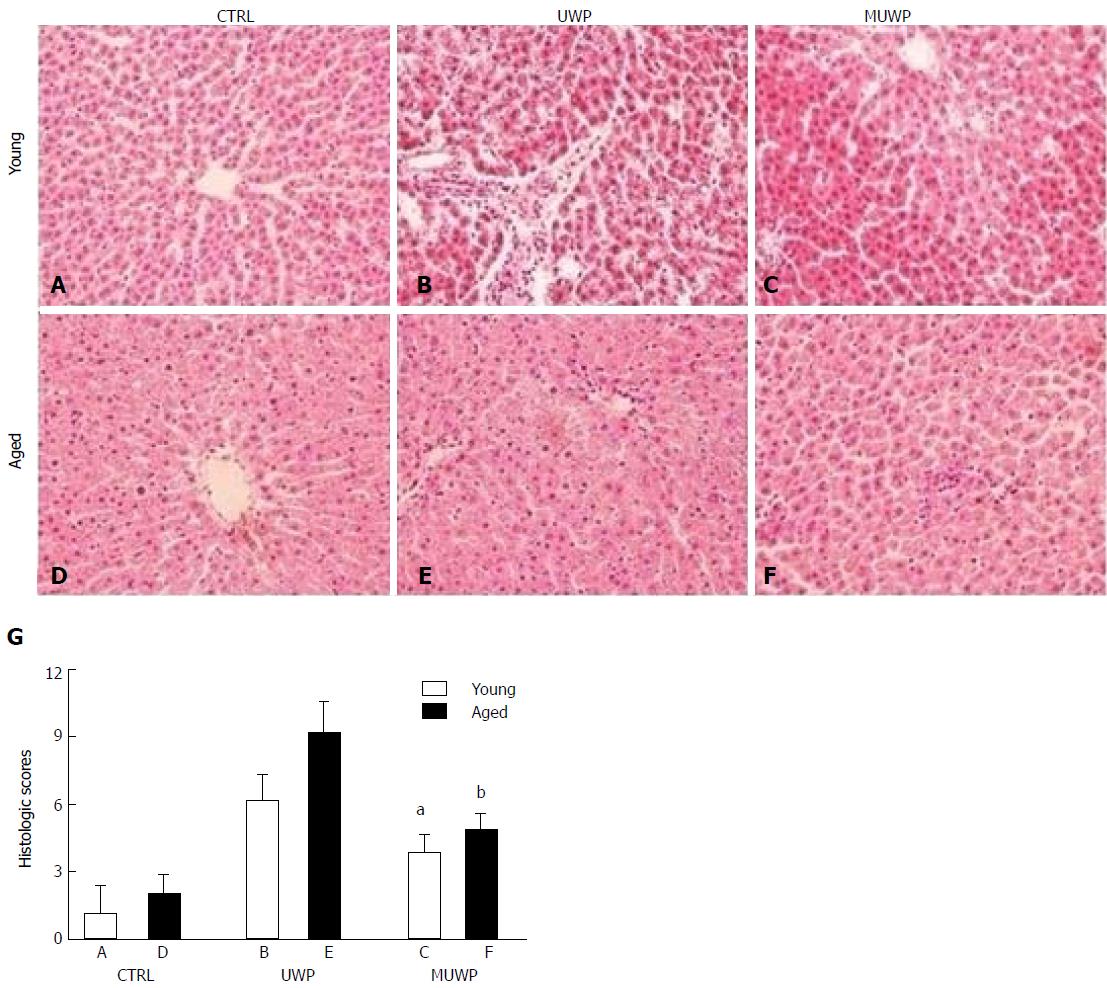
Figure 4 Staining of the slices of ex vivo rat liver tissue.
A and D: The young control group A and the aged control group D, respectively; B and E: The young group B and aged group E of UWP, respectively; C and F: The young group C and the aged group F of MUWP, respectively; G: Histopathologic scoring of structural injury in each group. Data are presented as mean ± SD (n = 6) and compared by Kruskal-Wallis one-way analysis of variance on ranks and Mann-Whitney U test. aP < 0.05 vs group B of UWP; bP < 0.05 vs group E of UWP. Original magnification (A-F): × 400. UWP: University of Wisconsin solution perfusion; MUWP: Metformin perfusion solution.
- Citation: Chai YC, Dang GX, He HQ, Shi JH, Zhang HK, Zhang RT, Wang B, Hu LS, Lv Y. Hypothermic machine perfusion with metformin-University of Wisconsin solution for ex vivo preservation of standard and marginal liver grafts in a rat model. World J Gastroenterol 2017; 23(40): 7221-7231
- URL: https://www.wjgnet.com/1007-9327/full/v23/i40/7221.htm
- DOI: https://dx.doi.org/10.3748/wjg.v23.i40.7221


