Copyright
©The Author(s) 2017.
World J Gastroenterol. Oct 28, 2017; 23(40): 7221-7231
Published online Oct 28, 2017. doi: 10.3748/wjg.v23.i40.7221
Published online Oct 28, 2017. doi: 10.3748/wjg.v23.i40.7221
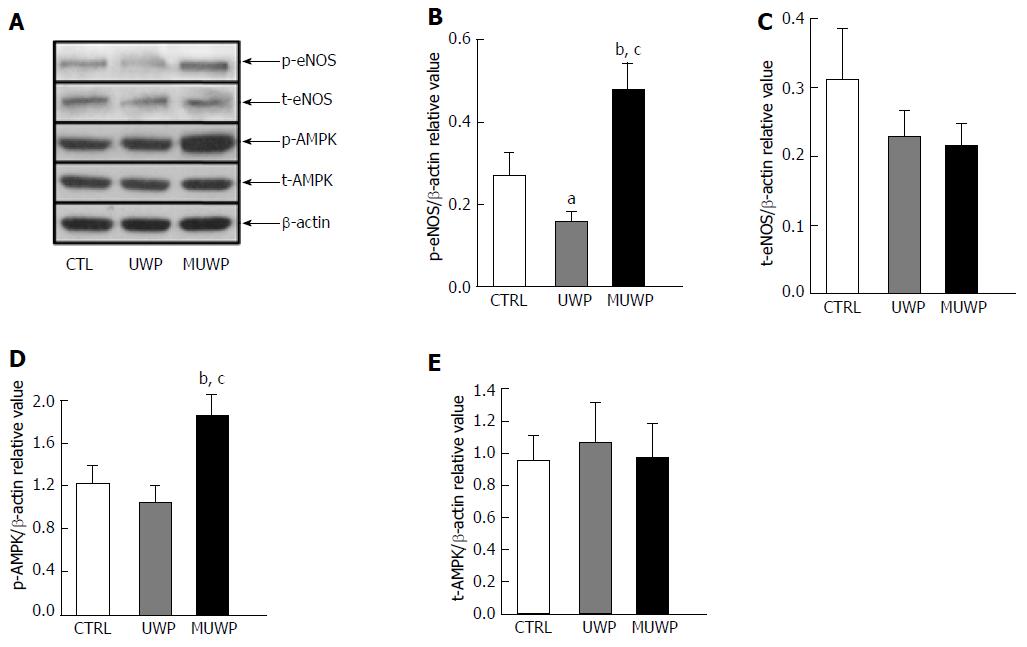
Figure 3 Histograms of relative gray values of the expression levels of p-eNOS, t-eNOS, p-AMPK, and t-AMPK in the liver sinusoidal endothelial cells of young rats.
AMPK/eNOS pathway was activated ex vivo by metformin. A: Phosphorylation of AMPK and eNOS was increased in the MUWP group at 12 h after HMP; B-E: Quantitative analysis of total AMPK, total NOS, phosphorylated AMPK, and eNOS expression in CTRL (control groups A and D), UWP (UW solution perfusion groups B and E), and MUWP (metformin perfusion groups C and F) groups. Data are presented as mean ± SD (n = 3) and compared by ordinary one-way analysis of variance and the Dunnett's multiple comparisons test. aP < 0.05 vs CTRL group; bP < 0.05 vs CTRL group; cP < 0.05 vs UWP group.
- Citation: Chai YC, Dang GX, He HQ, Shi JH, Zhang HK, Zhang RT, Wang B, Hu LS, Lv Y. Hypothermic machine perfusion with metformin-University of Wisconsin solution for ex vivo preservation of standard and marginal liver grafts in a rat model. World J Gastroenterol 2017; 23(40): 7221-7231
- URL: https://www.wjgnet.com/1007-9327/full/v23/i40/7221.htm
- DOI: https://dx.doi.org/10.3748/wjg.v23.i40.7221


