Copyright
©The Author(s) 2017.
World J Gastroenterol. Oct 28, 2017; 23(40): 7221-7231
Published online Oct 28, 2017. doi: 10.3748/wjg.v23.i40.7221
Published online Oct 28, 2017. doi: 10.3748/wjg.v23.i40.7221
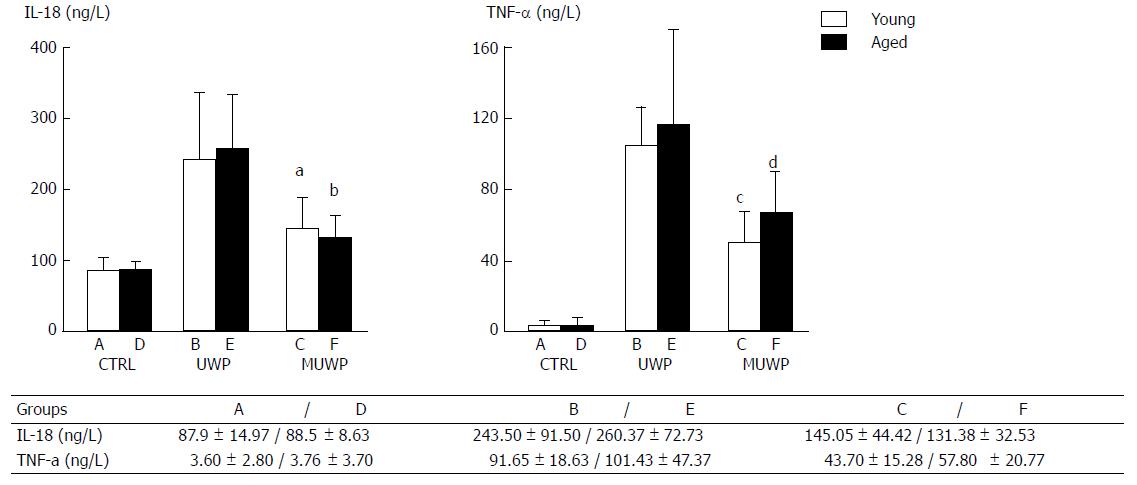
Figure 2 Analysis of inflammatory factors in the perfused liquid.
The IL-18 and TNF-α levels in the perfused liquid (mean ± SD) of the ex vivo livers of the three groups: CTRL (control groups A and D), UWP (UW solution perfusion groups B and E), and MUWP (metformin perfusion groups C and F). Data are presented as mean ± SD (n = 6) and compared by two-way analysis of variance and the Tukey's and Sidak's multiple comparisons tests. aP < 0.05 vs group B; bP < 0.05 vs group E; cP < 0.05 vs group B; dP < 0.05 vs group E.
- Citation: Chai YC, Dang GX, He HQ, Shi JH, Zhang HK, Zhang RT, Wang B, Hu LS, Lv Y. Hypothermic machine perfusion with metformin-University of Wisconsin solution for ex vivo preservation of standard and marginal liver grafts in a rat model. World J Gastroenterol 2017; 23(40): 7221-7231
- URL: https://www.wjgnet.com/1007-9327/full/v23/i40/7221.htm
- DOI: https://dx.doi.org/10.3748/wjg.v23.i40.7221


