Copyright
©The Author(s) 2017.
World J Gastroenterol. Jan 28, 2017; 23(4): 573-589
Published online Jan 28, 2017. doi: 10.3748/wjg.v23.i4.573
Published online Jan 28, 2017. doi: 10.3748/wjg.v23.i4.573
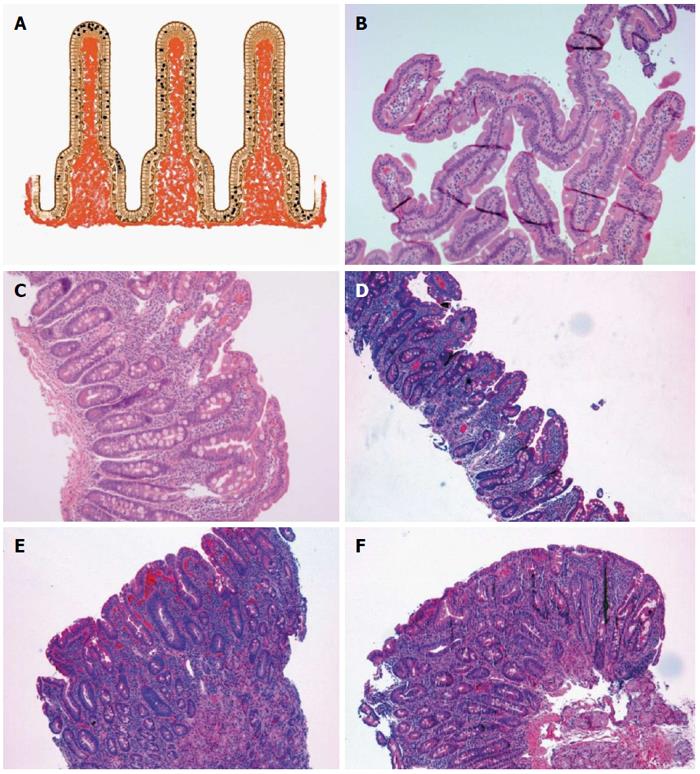
Figure 2 Intraepithelial lymphocytes and Marsh classification.
A: Schema of the intraepithelial distribution of the intraepithelial lymphocytes (top, side and bottom, see text); B: Marsh 0, normal villous architecture with en-face cut (HE, × 100); C: Marsh I (HE, × 100); D: Marsh IIIA (HE, × 100); E: Marsh IIIB (HE, × 100); F: Marsh IIIC (HE, × 100). Marsh-Oberhuber classification is often shortened as Marsh.
- Citation: Sergi C, Shen F, Bouma G. Intraepithelial lymphocytes, scores, mimickers and challenges in diagnosing gluten-sensitive enteropathy (celiac disease). World J Gastroenterol 2017; 23(4): 573-589
- URL: https://www.wjgnet.com/1007-9327/full/v23/i4/573.htm
- DOI: https://dx.doi.org/10.3748/wjg.v23.i4.573


