Copyright
©The Author(s) 2017.
World J Gastroenterol. Oct 14, 2017; 23(38): 6962-6972
Published online Oct 14, 2017. doi: 10.3748/wjg.v23.i38.6962
Published online Oct 14, 2017. doi: 10.3748/wjg.v23.i38.6962
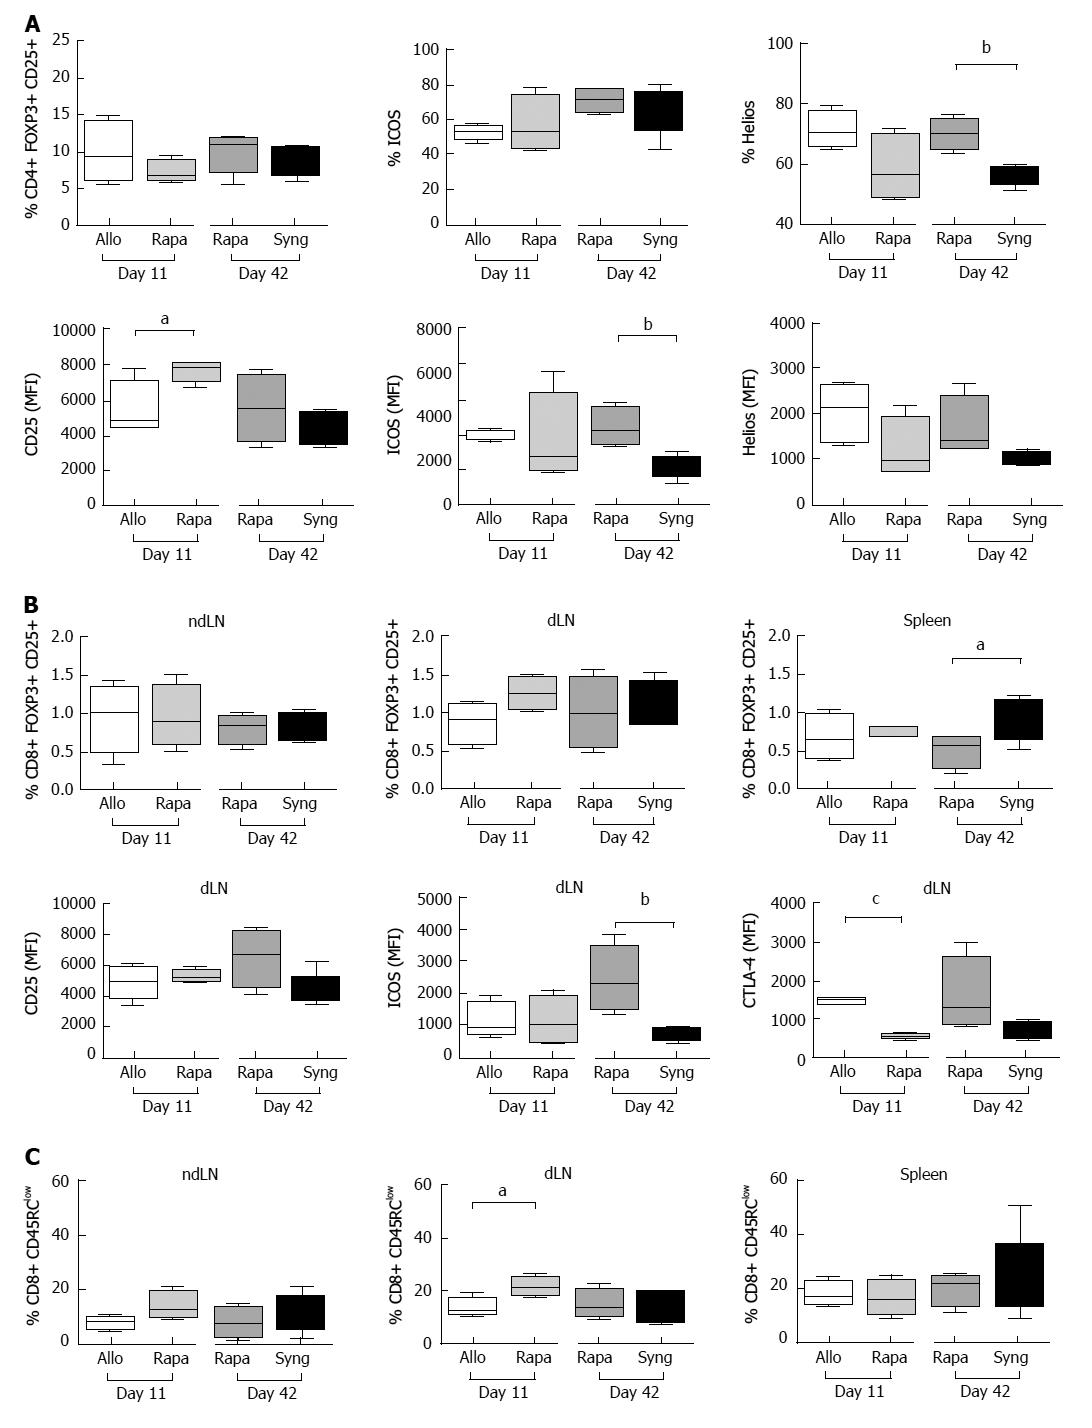
Figure 4 The effects of a short course of rapamycin treatment on CD4+ and CD8+ regulatory T cell phenotypes.
A: The dLNs of grafted animals were collected on day 11 and day 42 and regulatory CD4+ T cells were analyzed by flow cytometry. Different activation markers were studied (CD25+, ICOS+, Helios+) after gating on CD25+FOXP3+ among CD4+ cells. The results are expressed as the mean +/- SEM of the percentages of CD25+, ICOS+, and Helios+ or the MFI values for CD25, ICOS, and Helios; n = 4-5 rats/group. P-values are indicated when the differences between the two groups of rats are significant (aP ≤ 0.05, bP ≤ 0.01). MFI, mean fluorescence intensity; B: The ndLNs, dLNs and spleens of grafted animals were collected on day 11 and day 42 and the percentages of CD25+Foxp3+ regulatory CD8+ T cells were analyzed by flow cytometry. The MFI values of the activation markers (CD25, ICOS, and CTLA-4) are shown for the dLNs. The results are expressed as the mean +/- SEM. P-values are indicated when the differences between the two groups of rats are significant (aP ≤ 0.05, bP ≤ 0.01, cP ≤ 0.0001); C: The percentages of CD45RClow cells among CD8+ cells in the dLNs, ndLNs and spleens of grafted rats are shown. The results are expressed as the mean +/- SEM. P-values are indicated when the differences between the two groups of rats are significant (aP ≤ 0.05).
- Citation: Hamdani S, Thiolat A, Naserian S, Grondin C, Moutereau S, Hulin A, Calderaro J, Grimbert P, Cohen JL, Azoulay D, Pilon C. Delayed and short course of rapamycin prevents organ rejection after allogeneic liver transplantation in rats. World J Gastroenterol 2017; 23(38): 6962-6972
- URL: https://www.wjgnet.com/1007-9327/full/v23/i38/6962.htm
- DOI: https://dx.doi.org/10.3748/wjg.v23.i38.6962


