Copyright
©The Author(s) 2017.
World J Gastroenterol. Oct 7, 2017; 23(37): 6833-6844
Published online Oct 7, 2017. doi: 10.3748/wjg.v23.i37.6833
Published online Oct 7, 2017. doi: 10.3748/wjg.v23.i37.6833
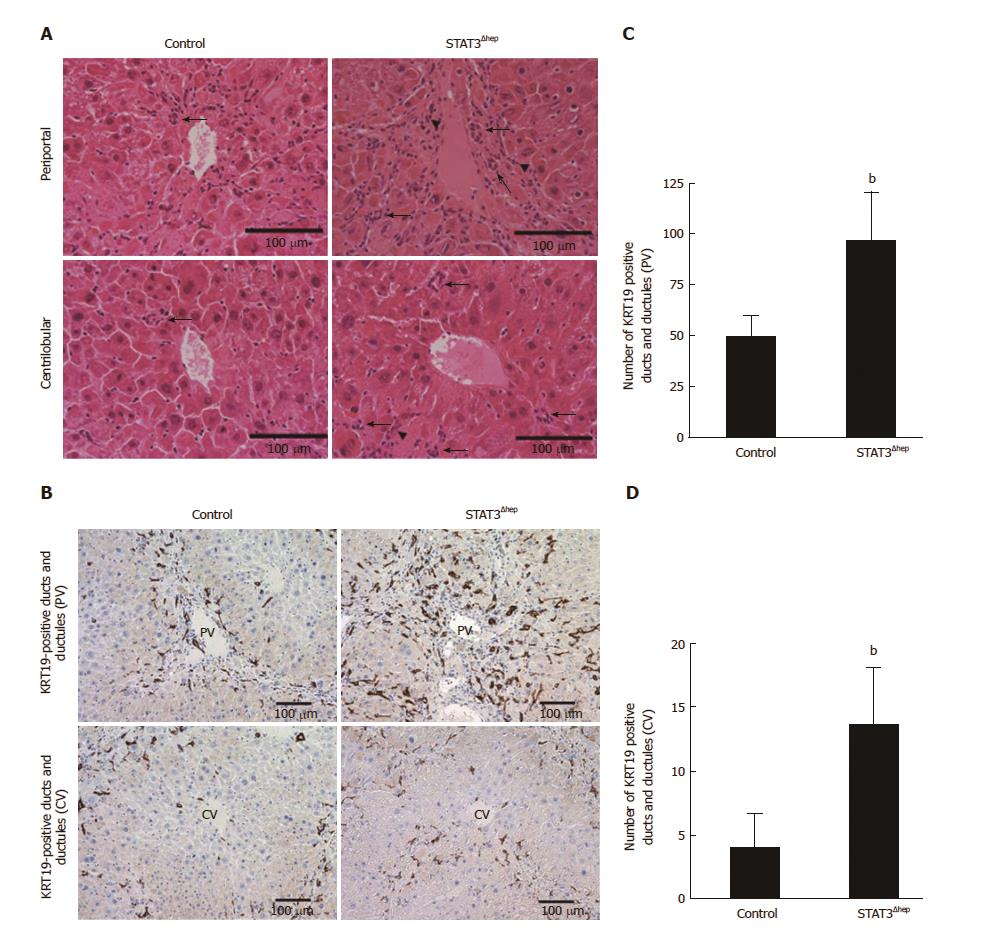
Figure 3 Increase in the formation of bile ducts and ductular structure in hepatic STAT3 deficient liver.
A: Hematoxylin and eosin staining images of representative areas around portal vein (PV) and central vein (CV) of control and STAT3Δhep livers following treatment with TAA for 16 wk. TAA treatment caused bile ducts/ductular formation (arrow). B: Immunohistochemistry staining for keratin 19 (KRT19) in control and STAT3Δhep livers following TAA treatment for 16 wk. Original magnification × 200. C and D: The number of KRT19-positive bile ducts/ductules around PV and CV. To quantify the number of bile ducts/ductules around PV and CV, we observed three different samples per group using 20 × objective lens, imaged five randomly selected cross-sectional veins in the center of field, and calculated the average value after counting the bile duct/ductule number in the total area of the image. Values represent means ± SE of the mean. bP < 0.01 [(C) P = 0.00272, (D) P = 0.00187] vs control. TAA: Thioacetamide.
- Citation: Abe M, Yoshida T, Akiba J, Ikezono Y, Wada F, Masuda A, Sakaue T, Tanaka T, Iwamoto H, Nakamura T, Sata M, Koga H, Yoshimura A, Torimura T. STAT3 deficiency prevents hepatocarcinogenesis and promotes biliary proliferation in thioacetamide-induced liver injury. World J Gastroenterol 2017; 23(37): 6833-6844
- URL: https://www.wjgnet.com/1007-9327/full/v23/i37/6833.htm
- DOI: https://dx.doi.org/10.3748/wjg.v23.i37.6833


