Copyright
©The Author(s) 2017.
World J Gastroenterol. Oct 7, 2017; 23(37): 6817-6832
Published online Oct 7, 2017. doi: 10.3748/wjg.v23.i37.6817
Published online Oct 7, 2017. doi: 10.3748/wjg.v23.i37.6817
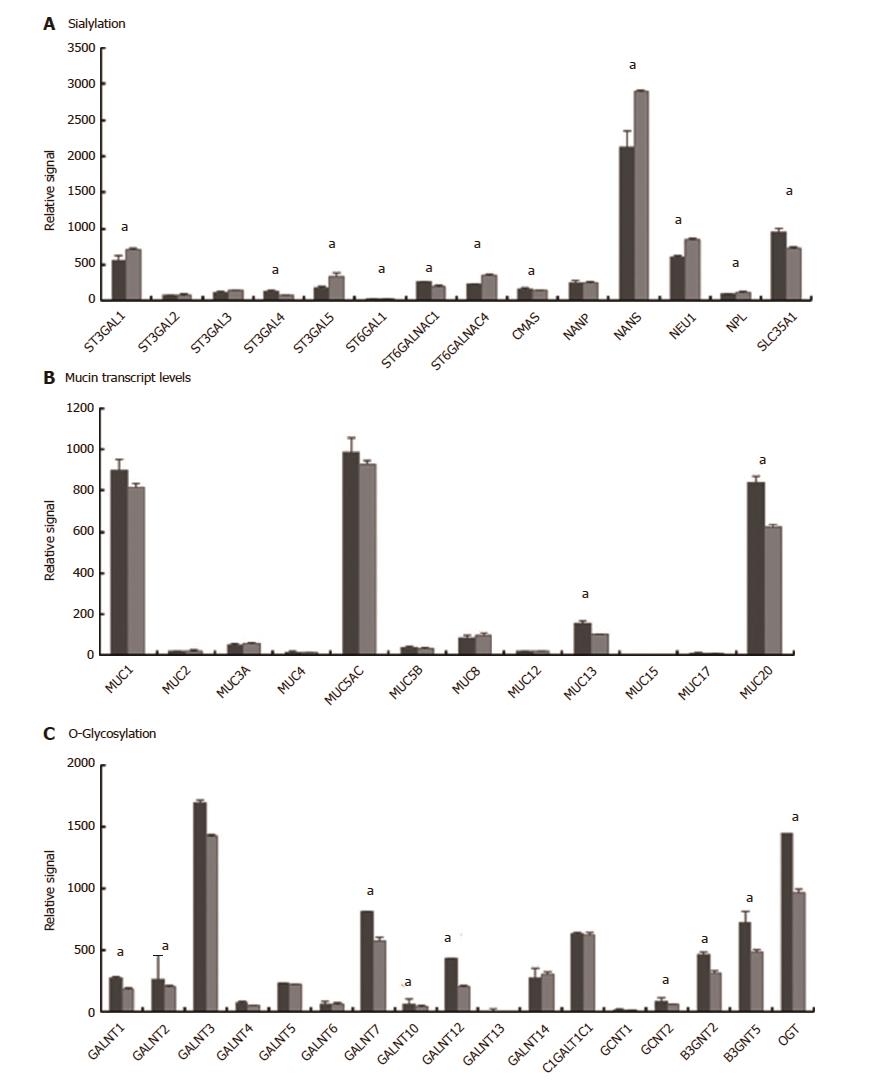
Figure 2 Transcript levels determined by microarray analysis of selected glycosylation related processes.
A: Sialylation-related genes; B: Mucin genes; C: O-glycosylation genes. Raw signals reported for each gene were the strongest signals where multiple probes were available (except for MUC2 where the negligible signal from the single probe, indicating very weak expression, was confirmed by qRT-PCR). All signals for uninfected samples were raw values whereas all infected samples were extracted using fold change values of normalised data as detailed in Materials and Methods. Uninfected (dark grey) or Infected (light grey). Error bars show standard deviations (n = 3). (aFDR < 0.05).
- Citation: Cairns MT, Gupta A, Naughton JA, Kane M, Clyne M, Joshi L. Glycosylation-related gene expression in HT29-MTX-E12 cells upon infection by Helicobacter pylori. World J Gastroenterol 2017; 23(37): 6817-6832
- URL: https://www.wjgnet.com/1007-9327/full/v23/i37/6817.htm
- DOI: https://dx.doi.org/10.3748/wjg.v23.i37.6817


