Copyright
©The Author(s) 2017.
World J Gastroenterol. Oct 7, 2017; 23(37): 6817-6832
Published online Oct 7, 2017. doi: 10.3748/wjg.v23.i37.6817
Published online Oct 7, 2017. doi: 10.3748/wjg.v23.i37.6817
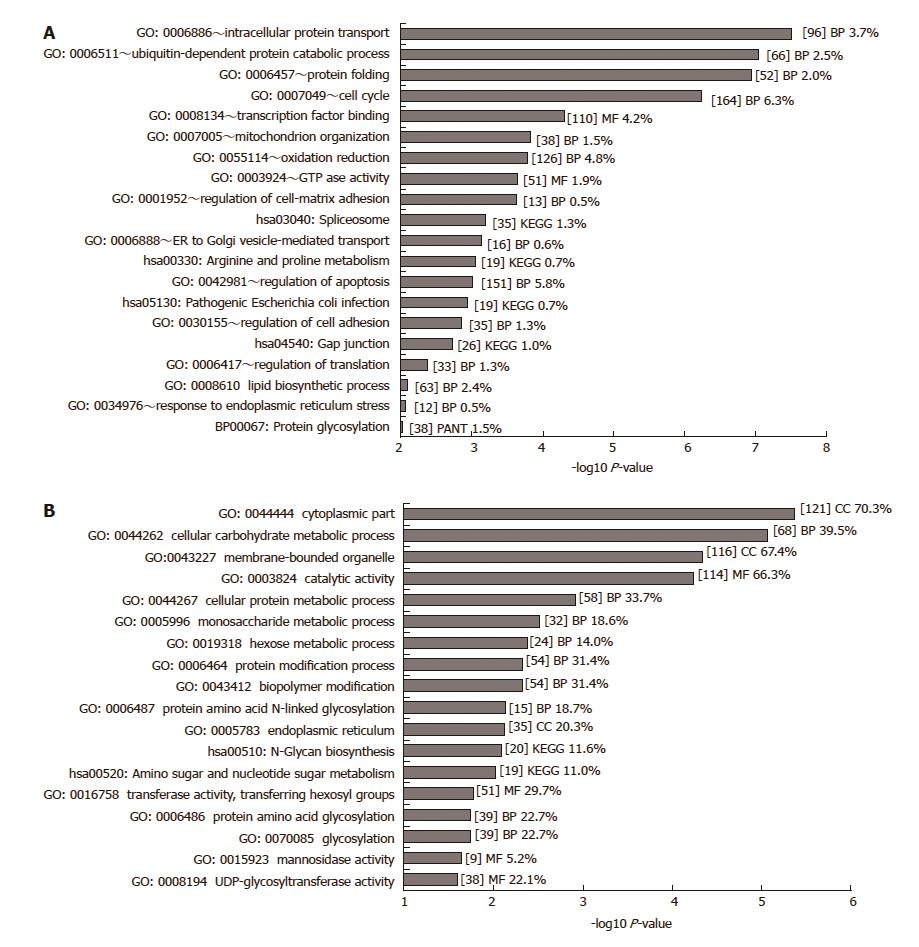
Figure 1 GO analysis of significant differentially expressed genes.
A: GO analysis of 2639 genes deemed significantly differentially expressed (P < 0.01, fold change > 1.2) was carried out in DAVID. Only GO terms with a P-value below 0.01 are shown (-log10 P-value > 2). GO terms were excluded where the number of genes belonging to that GO term exceeded 10% of all genes. B: GO analysis of 374 significantly differentially expressed glycosylation-related genes (P < 0.001) was carried out in DAVID. Only GO terms with a P-value below 0.1 are shown (-log10 P-value > 1). Some Panther (PANT) gene ontology and KEGG pathway terms were included from the DAVID analysis. The number of genes included in each term is given within square brackets [ ] together with the percentage of significant genes relative to the total number of genes of that term on the array. BP: Biochemical process; MF: Molecular function; CC: Cellular component.
- Citation: Cairns MT, Gupta A, Naughton JA, Kane M, Clyne M, Joshi L. Glycosylation-related gene expression in HT29-MTX-E12 cells upon infection by Helicobacter pylori. World J Gastroenterol 2017; 23(37): 6817-6832
- URL: https://www.wjgnet.com/1007-9327/full/v23/i37/6817.htm
- DOI: https://dx.doi.org/10.3748/wjg.v23.i37.6817


