Copyright
©The Author(s) 2017.
World J Gastroenterol. Sep 28, 2017; 23(36): 6694-6704
Published online Sep 28, 2017. doi: 10.3748/wjg.v23.i36.6694
Published online Sep 28, 2017. doi: 10.3748/wjg.v23.i36.6694
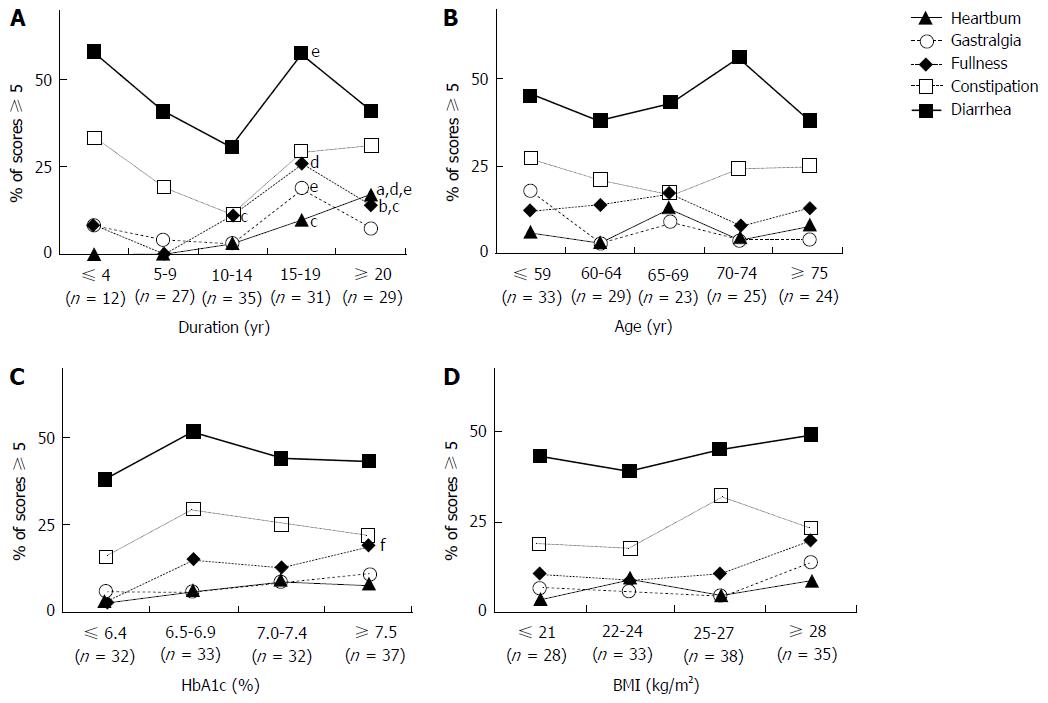
Figure 2 Relationships of abdominal symptoms with duration of diabetes, age, body mass index and hemoglobin A1c.
The lines show the percentages of subjects with a score of 5 or higher, for each GI region, among those considered to be sufficiently symptomatic to impair quality of life. Comparisons among groups with five disease duration periods (A), five age ranges (B), four HbA1c levels (C) and four BMI levels (D) were performed using a Cochran-Armitage-trend-test. aP < 0.05 or bP < 0.01, significantly different. As shown in the figure (A), scores for heartburn (P = 0.004) and postprandial fullness (P = 0.029) consistently and significantly increased with disease duration. Student’s t-tests for paired samples were performed to compare percentages of subjects with a score of 5 or higher, for each GI region, among five durations of diabetes (A), five age ranges (B), four HbA1c levels (C) and four BMI levels (D). cP < 0.05 vs 5-9 years, dP < 0.01 vs 5-9 years, or eP < 0.05 vs 10-14 years when compared with other disease duration periods and fP < 0.05 vs 6.4% or less which indicate significant differences. As shown in the figure (A), percentages of subjects with a score of 5 or higher for all symptoms except constipation in the disease duration period of 15-19 years were significantly higher than those in the 5-9 years and 10-14 years periods; P = 0.048 for heartburn, P = 0.024 for gastralgia, P = 0.008 for fullness and P = 0.03 for diarrhea. Likewise, percentages of subjects with a score of 5 or higher for heartburn and fullness in the disease duration period of 20 years or more were significantly higher than those in the 5-9 years and 10-14 years periods; P = 0.01 and P = 0.04 for heartburn and P = 0.02 for fullness. Furthermore, the percentage of subjects with a score of 5 or higher for fullness in the disease duration period of 10-14 yr was significantly higher than that in the 5-9 years period (P = 0.029). As shown in the figure (C), the percentage of subjects with a score of 5 or higher for fullness in those with HbA1c levels of 7.5% or above was significantly higher than that in those whose HbA1c was 6.4% or less (P = 0.030). BMI: Body mass index; HbA1c: Hemoglobin A1c.
- Citation: Fujishiro M, Kushiyama A, Yamazaki H, Kaneko S, Koketsu Y, Yamamotoya T, Kikuchi T, Sakoda H, Suzuki R, Kadowaki T. Gastrointestinal symptom prevalence depends on disease duration and gastrointestinal region in type 2 diabetes mellitus. World J Gastroenterol 2017; 23(36): 6694-6704
- URL: https://www.wjgnet.com/1007-9327/full/v23/i36/6694.htm
- DOI: https://dx.doi.org/10.3748/wjg.v23.i36.6694


