Copyright
©The Author(s) 2017.
World J Gastroenterol. Sep 28, 2017; 23(36): 6694-6704
Published online Sep 28, 2017. doi: 10.3748/wjg.v23.i36.6694
Published online Sep 28, 2017. doi: 10.3748/wjg.v23.i36.6694
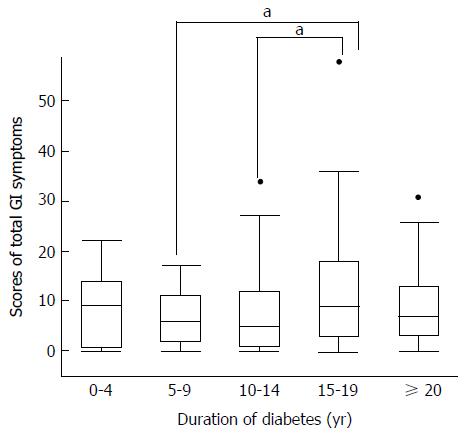
Figure 1 Distribution of the sum of scores of symptoms related to all GI areas by duration of diabetes.
aP < 0.05, significantly different. Sums of symptom scores peaked during the 15- to 19-yr diabetes duration period, compared by Student’s t-tests for paired periods (P = 0.01 and P = 0.02 when compared with 5-9 yr and 10-14 yr disease durations, respectively).
- Citation: Fujishiro M, Kushiyama A, Yamazaki H, Kaneko S, Koketsu Y, Yamamotoya T, Kikuchi T, Sakoda H, Suzuki R, Kadowaki T. Gastrointestinal symptom prevalence depends on disease duration and gastrointestinal region in type 2 diabetes mellitus. World J Gastroenterol 2017; 23(36): 6694-6704
- URL: https://www.wjgnet.com/1007-9327/full/v23/i36/6694.htm
- DOI: https://dx.doi.org/10.3748/wjg.v23.i36.6694


