Copyright
©The Author(s) 2017.
World J Gastroenterol. Sep 28, 2017; 23(36): 6665-6673
Published online Sep 28, 2017. doi: 10.3748/wjg.v23.i36.6665
Published online Sep 28, 2017. doi: 10.3748/wjg.v23.i36.6665
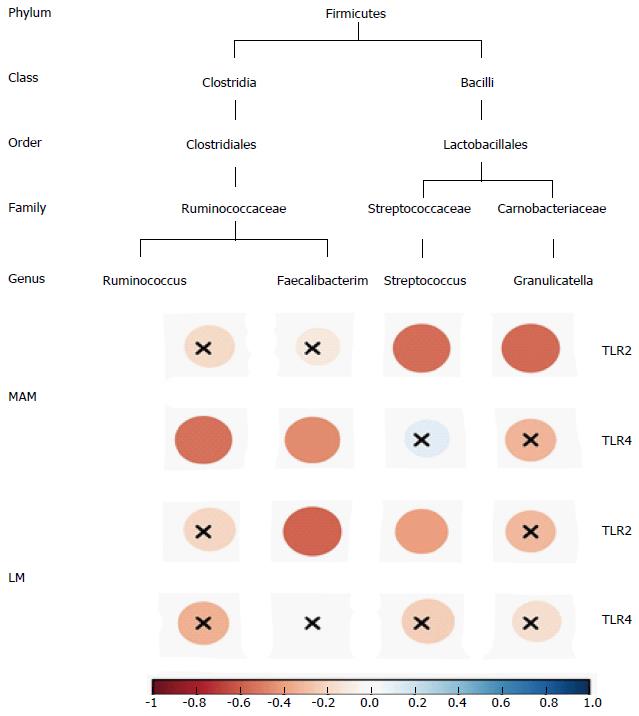
Figure 4 Correlogram showing the Pearson’s correlation between key genera and toll-like receptors in both faecal and mucosa samples.
Blue circles designate a positive correlation, while red ones designate a negative correlation. X means no significant result according to the significance level of 0.05. TLR: Toll-like receptor; MAM: Mucosa-associated microbiota; LM: Luminal microbiota.
- Citation: Dong LN, Wang JP, Liu P, Yang YF, Feng J, Han Y. Faecal and mucosal microbiota in patients with functional gastrointestinal disorders: Correlation with toll-like receptor 2/toll-like receptor 4 expression. World J Gastroenterol 2017; 23(36): 6665-6673
- URL: https://www.wjgnet.com/1007-9327/full/v23/i36/6665.htm
- DOI: https://dx.doi.org/10.3748/wjg.v23.i36.6665


