Copyright
©The Author(s) 2017.
World J Gastroenterol. Sep 28, 2017; 23(36): 6650-6664
Published online Sep 28, 2017. doi: 10.3748/wjg.v23.i36.6650
Published online Sep 28, 2017. doi: 10.3748/wjg.v23.i36.6650
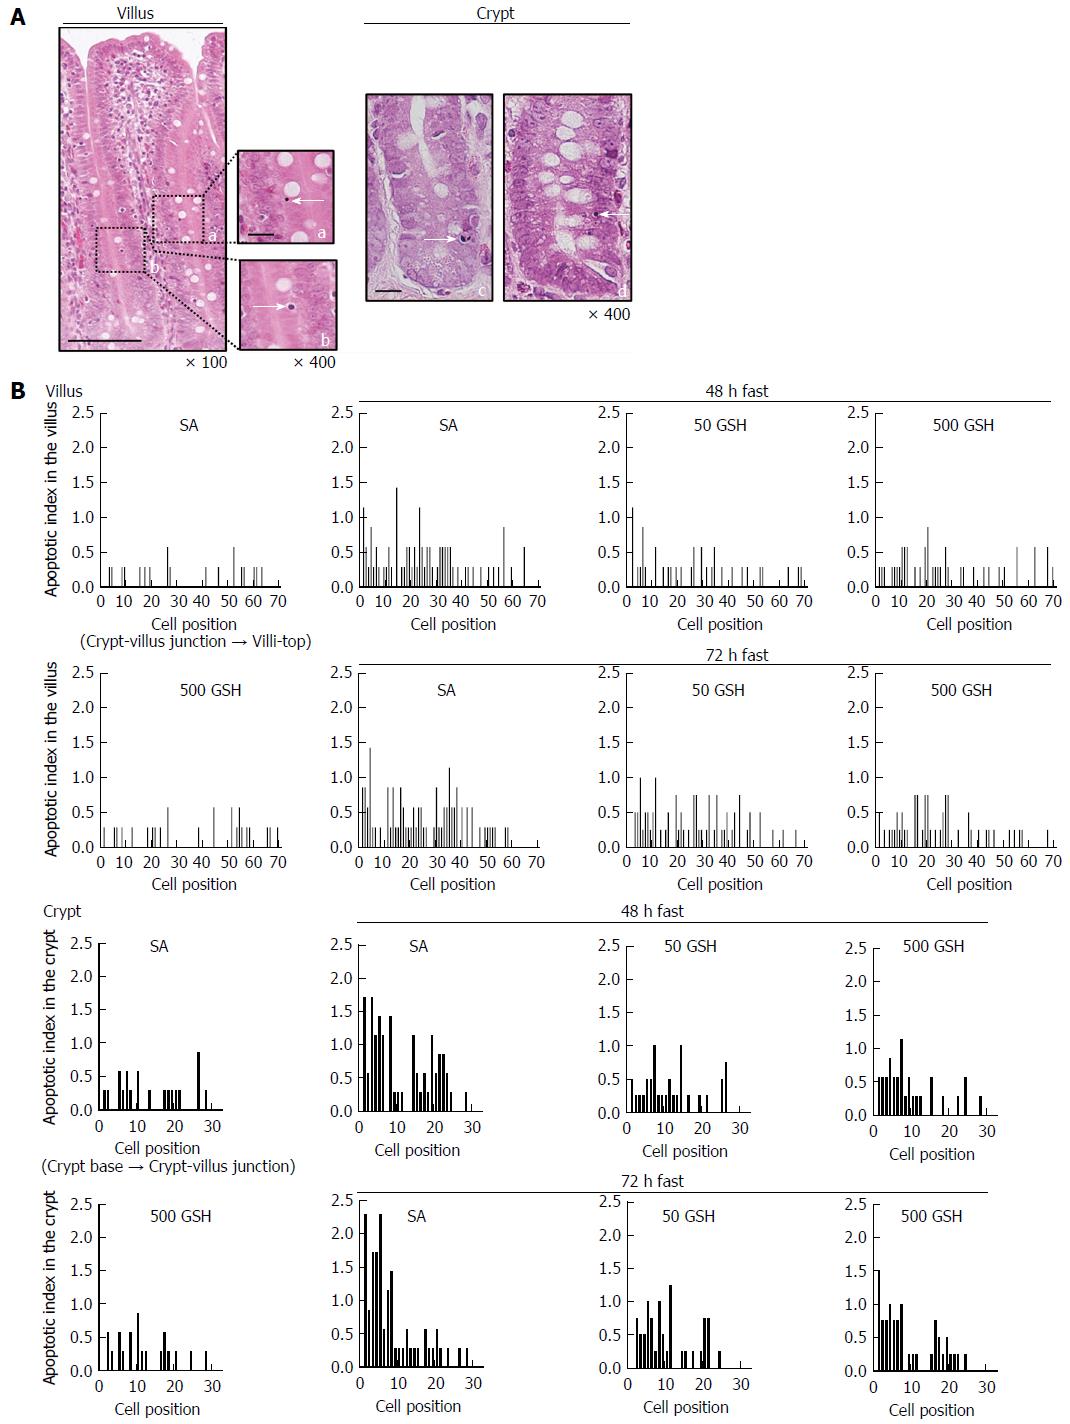
Figure 7 Effects of fasting and glutathione treatment on apoptotic index in the jejunal villus and crypt.
Representative apoptotic changes determined by conventional light microscopy of hematoxylin and eosin (HE)-stained sections of the jejunal mucosa are shown in A. Left side: A jejunal villus from a 72-h fasted rat with 500 mg/kg GSH treatment. Apoptotic cells in the villus are indicated by an arrow showing an apoptotic corpuscle (a) and condensed chromatin (b). Bar = 100 μm (low magnification). Bar = 20 μm (high magnification). Right side: Jejunal crypts from 48- and 72-h fasted rats. Apoptotic cells in the crypt are indicated by an arrow showing an intensely eosinophilic cytoplasm and nuclear fragmentation (c) and condensed chromatin (d). Bar = 20 μm. AI distribution curves in the villus and the crypt are shown in B. AI is defined as the total number of apoptotic cells at each cell position and is expressed as a percentage of the total number of cells counted at that cell position. Cell position 1 is defined as the cell at the crypt-villus junction and the cell at the base of the crypt column for the villus and crypt data, respectively. 7-8 rats were tested in each group. GSH: Glutathione; SA: Saline.
- Citation: Uchida H, Nakajima Y, Ohtake K, Ito J, Morita M, Kamimura A, Kobayashi J. Protective effects of oral glutathione on fasting-induced intestinal atrophy through oxidative stress. World J Gastroenterol 2017; 23(36): 6650-6664
- URL: https://www.wjgnet.com/1007-9327/full/v23/i36/6650.htm
- DOI: https://dx.doi.org/10.3748/wjg.v23.i36.6650


