Copyright
©The Author(s) 2017.
World J Gastroenterol. Sep 21, 2017; 23(35): 6385-6402
Published online Sep 21, 2017. doi: 10.3748/wjg.v23.i35.6385
Published online Sep 21, 2017. doi: 10.3748/wjg.v23.i35.6385
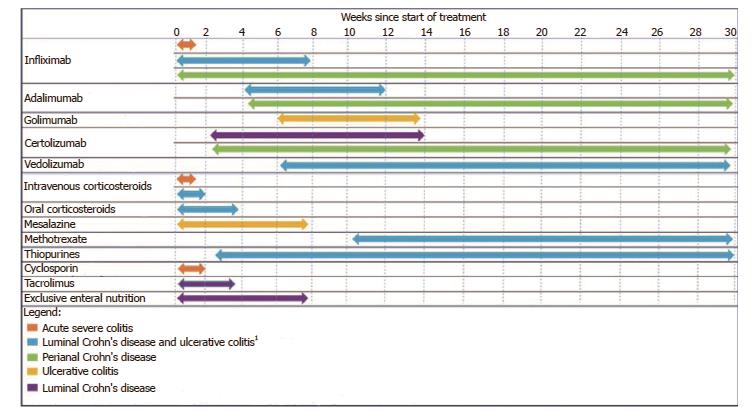
Figure 1 Schematic representation of the range of expected time of clinical response for therapies based on indication.
1This symbol is used to represent the expected time to response for therapies that can be used in either condition.
- Citation: Vasudevan A, Gibson PR, Langenberg DRV. Time to clinical response and remission for therapeutics in inflammatory bowel diseases: What should the clinician expect, what should patients be told? World J Gastroenterol 2017; 23(35): 6385-6402
- URL: https://www.wjgnet.com/1007-9327/full/v23/i35/6385.htm
- DOI: https://dx.doi.org/10.3748/wjg.v23.i35.6385


