Copyright
©The Author(s) 2017.
World J Gastroenterol. Sep 14, 2017; 23(34): 6339-6349
Published online Sep 14, 2017. doi: 10.3748/wjg.v23.i34.6339
Published online Sep 14, 2017. doi: 10.3748/wjg.v23.i34.6339
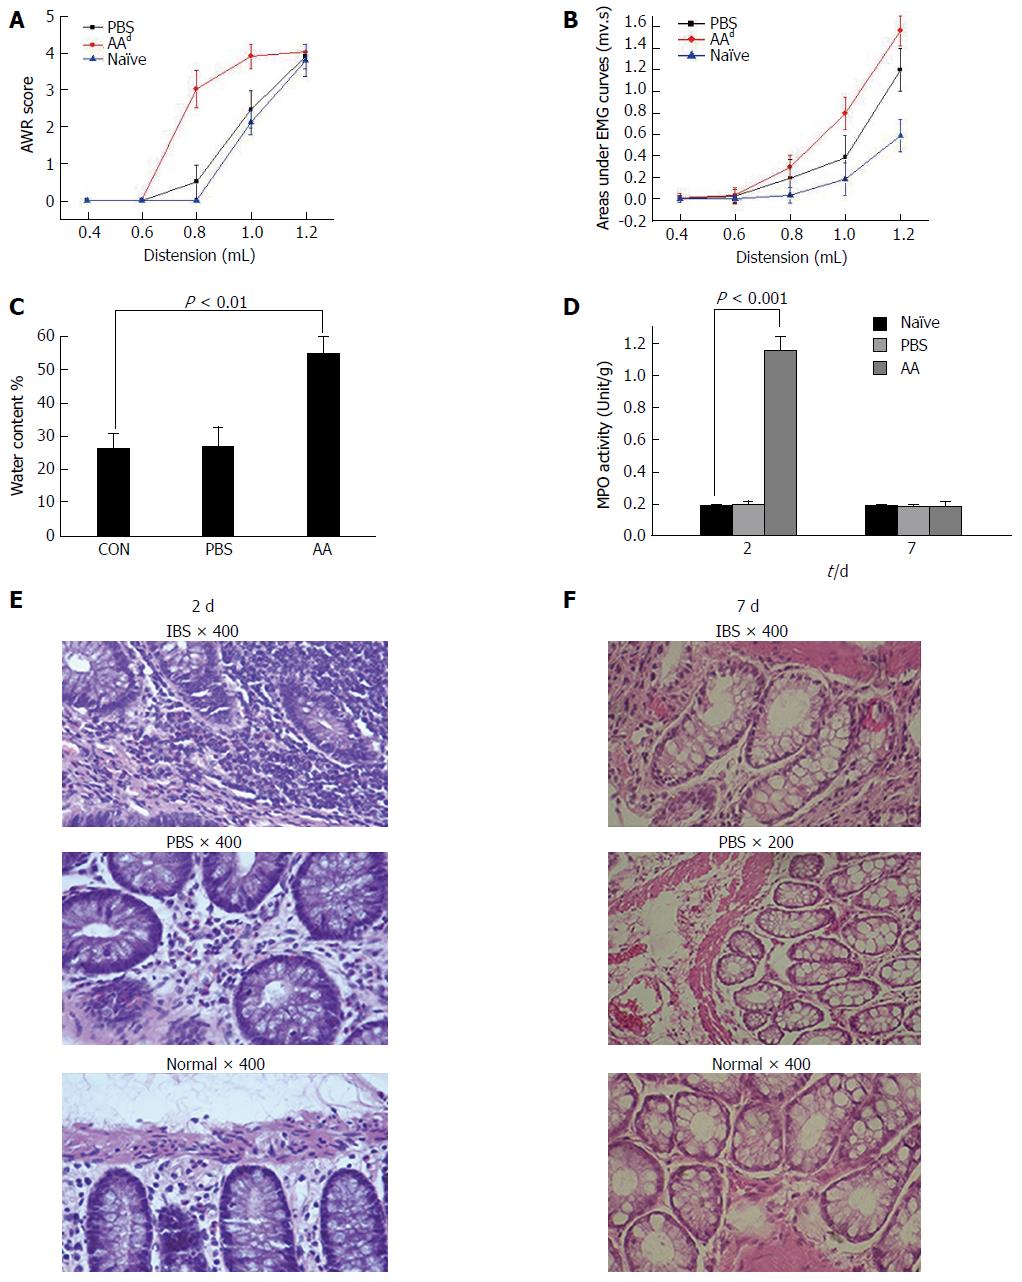
Figure 1 Model assessment using histological sections, myeloperoxidase activity, stool water content and visceral hypersensitivity in the acetic acid rats.
A and B: The AWR score was significantly increased at distension volumes of 0.8 and 1.0 mL in the AA model compared with the two control groups and overlapped at 1.2 mL on a highest score of 4. The AUC significantly increased at volumes of 0.8, 1.0 and 1.2 mL in the AA rats compared with the control groups. No significant change was found in the PBS group compared with naïve rats; C: The water contents of stools from the naïve, PBS and AA groups were compared (one-way ANOVA, P < 0.01). AA rats showed much looser stool, and the water content was much higher; D: Tissue MPO activity on the 2nd and 7th d of modeling. MPO activity of the AA group was increased on the 2nd d of modeling. No statistically significant difference was detected between the PBS and naïve groups on the 2nd and 7th d of modeling among the AA, PBS and naïve groups (one-way ANOVA, P < 0.001 vs the control groups); E and F: Histology sections of colonic tissue from AA, PBS and naïve rats on the 2nd and 7th d. On the 2nd d of modeling in the AA group, histological inflammatory features including mucosal hemorrhage, submucosal edema, and inflammatory infiltration in the lamina propria and submucosa were observed. No remarkable inflammatory features were observed in the two control groups on the 2nd d of modeling and in all the three groups (AA, PBS and naïve rats) on the 7th d of modeling. dP < 0.001 vs the control groups. AWR: Abdominal withdrawal reflex; AUC: Area under the electromyography curve; AA: acetic acid; IBS: Irritable bowel syndrome; EMG: Electromyography.
- Citation: Wu J, Cheng Y, Zhang R, Liu D, Luo YM, Chen KL, Ren S, Zhang J. P2Y1R is involved in visceral hypersensitivity in rats with experimental irritable bowel syndrome. World J Gastroenterol 2017; 23(34): 6339-6349
- URL: https://www.wjgnet.com/1007-9327/full/v23/i34/6339.htm
- DOI: https://dx.doi.org/10.3748/wjg.v23.i34.6339


