Copyright
©The Author(s) 2017.
World J Gastroenterol. Sep 7, 2017; 23(33): 6164-6171
Published online Sep 7, 2017. doi: 10.3748/wjg.v23.i33.6164
Published online Sep 7, 2017. doi: 10.3748/wjg.v23.i33.6164
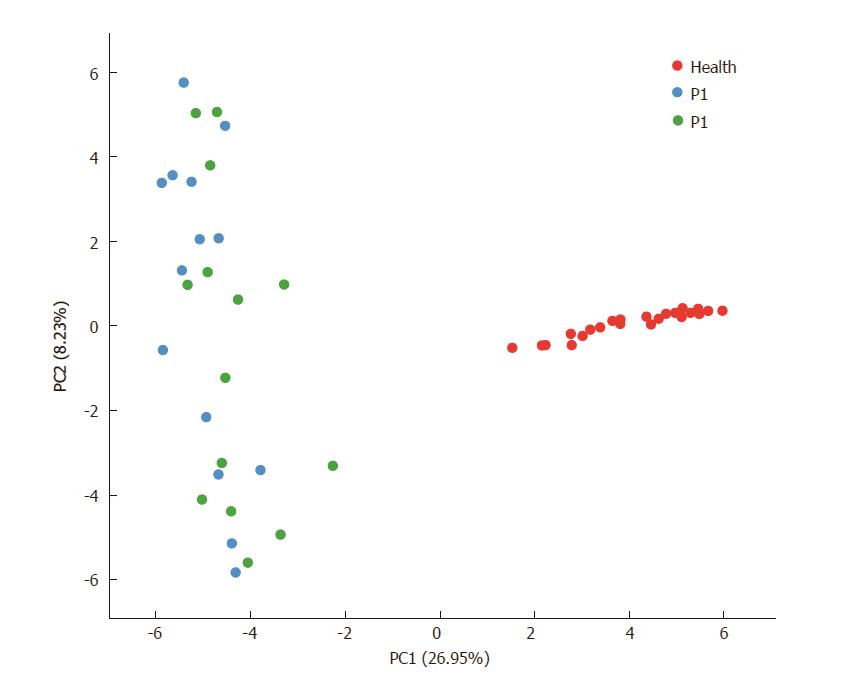
Figure 2 Principal component analysis.
Each plot in the principal component analysis (PCA) graph stands for a sample. Red, blue and green colors represent the Health, P1 and P2 groups, respectively.
- Citation: Xie G, Zhou Q, Qiu CZ, Dai WK, Wang HP, Li YH, Liao JX, Lu XG, Lin SF, Ye JH, Ma ZY, Wang WJ. Ketogenic diet poses a significant effect on imbalanced gut microbiota in infants with refractory epilepsy. World J Gastroenterol 2017; 23(33): 6164-6171
- URL: https://www.wjgnet.com/1007-9327/full/v23/i33/6164.htm
- DOI: https://dx.doi.org/10.3748/wjg.v23.i33.6164


