Copyright
©The Author(s) 2017.
World J Gastroenterol. Sep 7, 2017; 23(33): 6128-6136
Published online Sep 7, 2017. doi: 10.3748/wjg.v23.i33.6128
Published online Sep 7, 2017. doi: 10.3748/wjg.v23.i33.6128
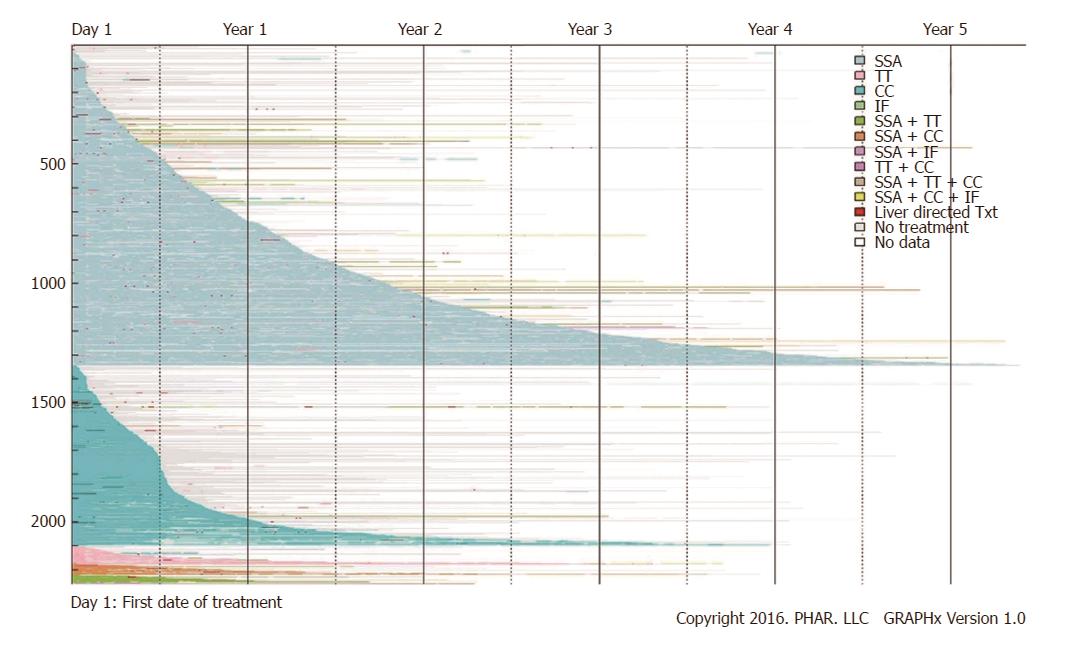
Figure 4 Pharmacologic treatment.
By end of study follow-up [mean (SD, median) of 576 d (447.1, 454)], 58.9% (n = 1331) patients had stopped pharmacologic therapy completely. These patients (no pharmacologic treatment claims, but remained enrolled in one of the databases) can be identified as colored line segments that terminate in gray segments of variable length, with the gray representing the period of no treatment. An additional 32.7% (n = 738) continued their initial therapy until the end of their enrollment; these patients were still receiving their first-line therapy at the time they left a covered plan or reached the end of study. This pattern is shown as a colored segment terminating in white. The remaining 8.4% (n = 189) were observed to change pharmacologic treatment during the follow-up period (a colored segment terminating in different colored segment). Liver directed therapy (short, red segments) appears dispersed throughout periods of both pharmacologic treatment (colored segments) and periods of no pharmacologic treatment (gray segments). SSA: Somatostatin analogues; CC: Cytotoxic chemotherapy; TT: Targeted therapy; IF: Interferon.
- Citation: Benson III AB, Broder MS, Cai B, Chang E, Neary MP, Papoyan E. Real-world treatment patterns of gastrointestinal neuroendocrine tumors: A claims database analysis. World J Gastroenterol 2017; 23(33): 6128-6136
- URL: https://www.wjgnet.com/1007-9327/full/v23/i33/6128.htm
- DOI: https://dx.doi.org/10.3748/wjg.v23.i33.6128


