Copyright
©The Author(s) 2017.
World J Gastroenterol. Sep 7, 2017; 23(33): 6100-6110
Published online Sep 7, 2017. doi: 10.3748/wjg.v23.i33.6100
Published online Sep 7, 2017. doi: 10.3748/wjg.v23.i33.6100
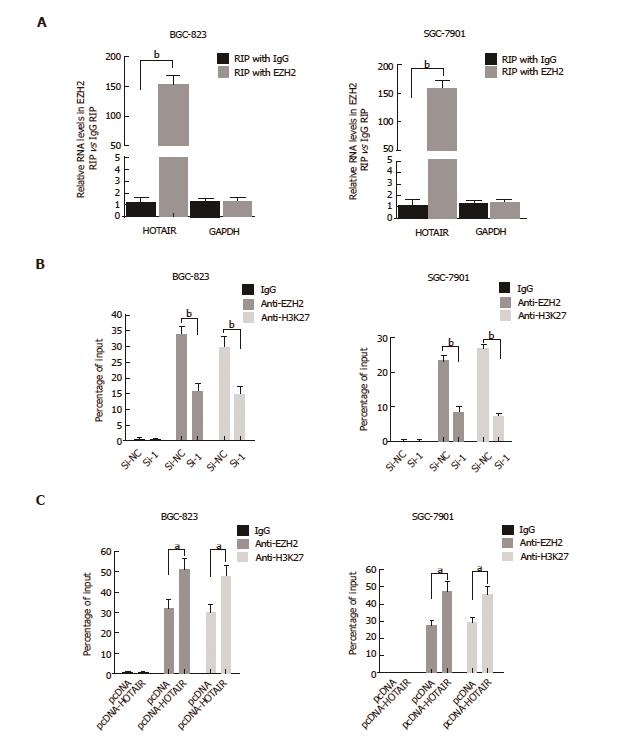
Figure 4 HOTAIR represses E-cadherin expression by associating with EZH2.
A: RIP experiments were performed in BGC-823 and SGC-7901 cells, and HOTAIR levels were analyzed in co-precipitated RNA using qPCR. The fold-enrichment of HOTAIR in EZH2 RIP is relative to its matching IgG control RIP (aP < 0.05, bP < 0.01); B: ChIP of EZH2 and H3K27me3 in the E-cadherin promoter regions after siRNA treatment targeting si-NC or HOTAIR-siRNA-1 in BGC-823 and SGC-7901 cells. qPCR was performed to quantify ChIP assay results. Enrichment was quantified relative to input controls. Antibody directed against IgG was used as a negative control. Results are represented as the average ± SD based on three independent experiments. aP < 0.05, bP < 0.01; C: ChIP of EZH2 and H3K27me3 in the E-cadherin promoter regions after transfected with empty vector (denoted as ‘pcDNA’) or pcDNA-HOTAIR in BGC-823 and SGC-7901 cells. qPCR was performed to quantify ChIP assay results. Enrichment was quantified relative to input controls. Results are represented as the average ± SD based on three independent experiments (aP < 0.05, bP < 0.01). ChIP: Chromatin immunoprecipitation; GC: Gastric cancer; HOTAIR: HOX transcript antisense intergenic RNA; qPCR: Quantitative polymerase chain reaction; RIP: RNA-binding protein immunoprecipitation; SD: Standard deviation; si: Small interfering.
- Citation: Chen WM, Chen WD, Jiang XM, Jia XF, Wang HM, Zhang QJ, Shu YQ, Zhao HB. HOX transcript antisense intergenic RNA represses E-cadherin expression by binding to EZH2 in gastric cancer. World J Gastroenterol 2017; 23(33): 6100-6110
- URL: https://www.wjgnet.com/1007-9327/full/v23/i33/6100.htm
- DOI: https://dx.doi.org/10.3748/wjg.v23.i33.6100


