Copyright
©The Author(s) 2017.
World J Gastroenterol. Sep 7, 2017; 23(33): 6100-6110
Published online Sep 7, 2017. doi: 10.3748/wjg.v23.i33.6100
Published online Sep 7, 2017. doi: 10.3748/wjg.v23.i33.6100
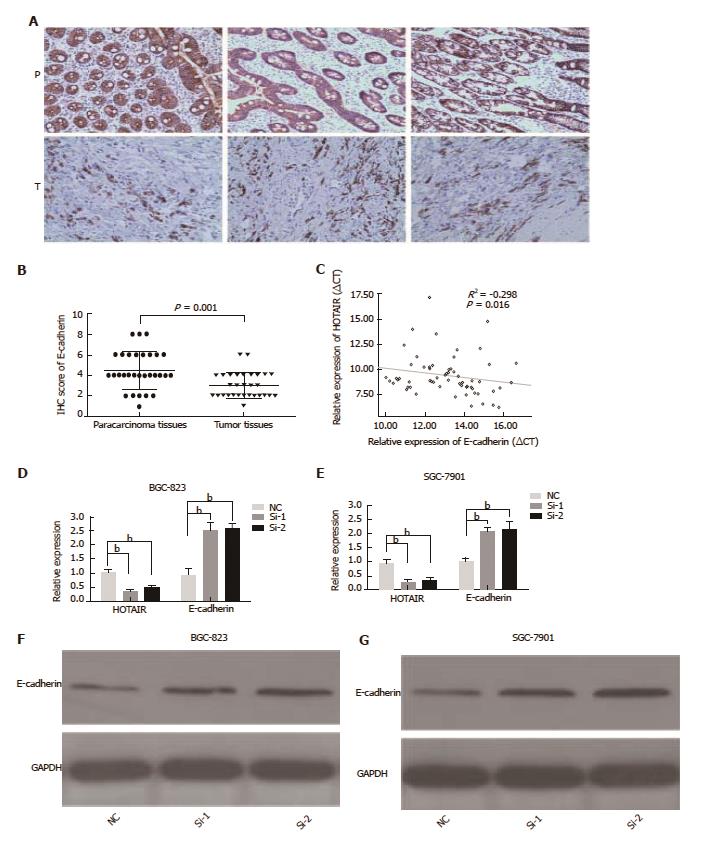
Figure 3 HOTAIR negatively correlates to E-cadherin expression in GC tissues and cell lines.
A: E-cadherin immunostaining in para-carcinoma tissues (denoted as ‘P’) and GC tissues (denoted as ‘T’); B: Representative E-cadherin protein levels and scores in GC tissues and para-carcinoma tissues was analyzed by immunohistochemistry (n = 30); C: Negative correlation between E-cadherin mRNA levels and HOTAIR levels in 65 GC samples; D, E: Relative expression of HOTAIR and E-cadherin in BGC-823 and SGC-7901 cells treated with siRNA for 48 h; F, G: Western blot analysis of E-cadherin after HOTAIR-siRNA (Si1 and Si2) treatment for 48 h in BGC-823 and SGC-7901 cells. aP < 0.05, bP < 0.01. GC: Gastric cancer; HOTAIR: HOX transcript antisense intergenic RNA; si: Small interfering.
- Citation: Chen WM, Chen WD, Jiang XM, Jia XF, Wang HM, Zhang QJ, Shu YQ, Zhao HB. HOX transcript antisense intergenic RNA represses E-cadherin expression by binding to EZH2 in gastric cancer. World J Gastroenterol 2017; 23(33): 6100-6110
- URL: https://www.wjgnet.com/1007-9327/full/v23/i33/6100.htm
- DOI: https://dx.doi.org/10.3748/wjg.v23.i33.6100


