Copyright
©The Author(s) 2017.
World J Gastroenterol. Sep 7, 2017; 23(33): 6077-6087
Published online Sep 7, 2017. doi: 10.3748/wjg.v23.i33.6077
Published online Sep 7, 2017. doi: 10.3748/wjg.v23.i33.6077
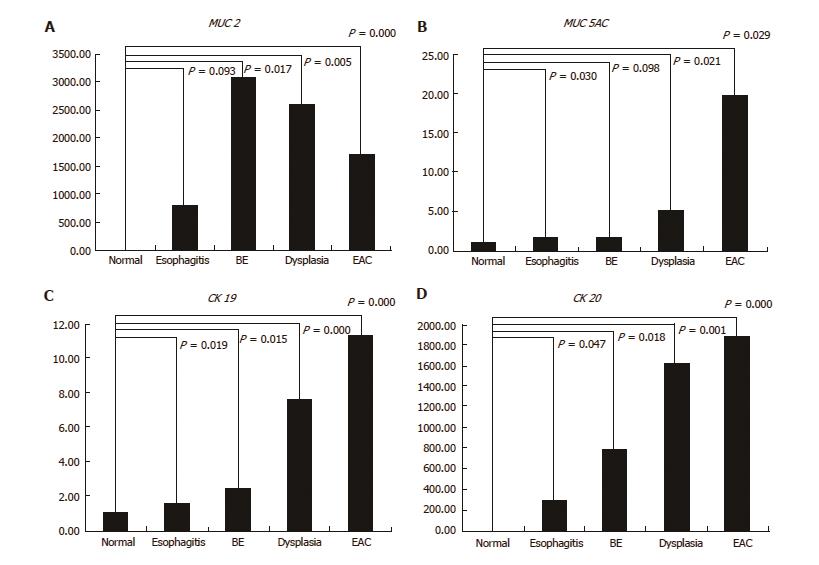
Figure 5 Panel A to D represents the relative gene expression level of MUC2, MUC5AC, CK19, and CK20 for each esophageal disease level, respectively.
BE: Barrett’s esophagus; EAC: esophageal adenocarcinoma.
- Citation: Matsui D, Omstead AN, Kosovec JE, Komatsu Y, Lloyd EJ, Raphael H, Kelly RJ, Zaidi AH, Jobe BA. High yield reproducible rat model recapitulating human Barrett’s carcinogenesis. World J Gastroenterol 2017; 23(33): 6077-6087
- URL: https://www.wjgnet.com/1007-9327/full/v23/i33/6077.htm
- DOI: https://dx.doi.org/10.3748/wjg.v23.i33.6077


