Copyright
©The Author(s) 2017.
World J Gastroenterol. Aug 28, 2017; 23(32): 5913-5924
Published online Aug 28, 2017. doi: 10.3748/wjg.v23.i32.5913
Published online Aug 28, 2017. doi: 10.3748/wjg.v23.i32.5913
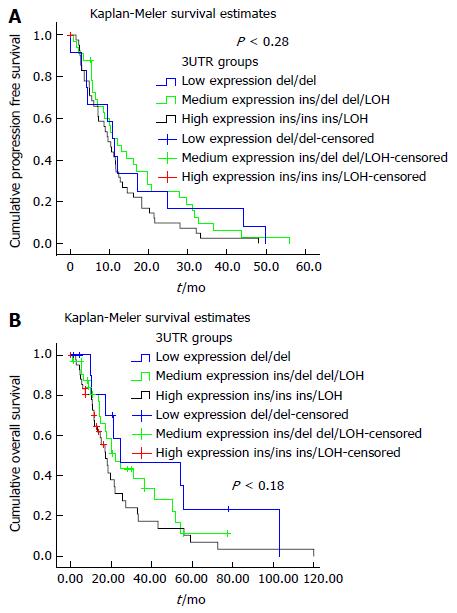
Figure 4 Kaplan-Meier survival curve.
A: Kaplan-Meier curve for PFS according to TYMS 3’UTR groups; B: Kaplan-Meier curve for OS according to TYMS 3’UTR groups. Comparisons were made using long-rank tests. OS: Overall survival; PFS: Progression-free survival; UTR: Untranslated region.
- Citation: Ntavatzikos A, Spathis A, Patapis P, Machairas N, Peros G, Konstantoudakis S, Leventakou D, Panayiotides IG, Karakitsos P, Koumarianou A. Integrating TYMS, KRAS and BRAF testing in patients with metastatic colorectal cancer. World J Gastroenterol 2017; 23(32): 5913-5924
- URL: https://www.wjgnet.com/1007-9327/full/v23/i32/5913.htm
- DOI: https://dx.doi.org/10.3748/wjg.v23.i32.5913


