Copyright
©The Author(s) 2017.
World J Gastroenterol. Aug 14, 2017; 23(30): 5499-5507
Published online Aug 14, 2017. doi: 10.3748/wjg.v23.i30.5499
Published online Aug 14, 2017. doi: 10.3748/wjg.v23.i30.5499
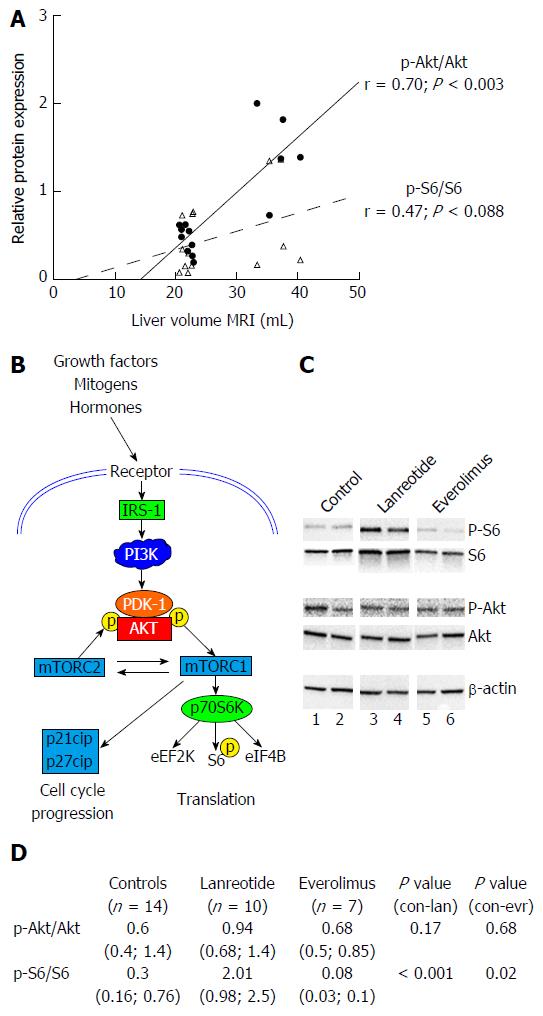
Figure 4 Analysis of protein expression of components of PI3K/AKT/mTOR pathway by Western blot in livers of PCK rats after 12 wk of treatment.
A: phosphorylation ratio in untreated animals: correlation between p-Akt/Akt ratio and p-S6/S6 ratio with liver volume. Pearson correlation (r) is given together with significance; B: Simplified schematic presentation of PI3K/AKT/mTOR signaling pathway; C: shows two representative samples from each experimental group; D: shows relative expression mean (range) of phosphorylated Akt vs total Akt (p-Akt/Akt) and S6 vs total S6 (p-S6/S6) with n as number of animals analyzed. Expression of proteins was normalized to β-actin levels.
- Citation: Temmerman F, Chen F, Libbrecht L, Vander Elst I, Windmolders P, Feng Y, Ni Y, De Smedt H, Nevens F, van Pelt J. Everolimus halts hepatic cystogenesis in a rodent model of polycystic-liver-disease. World J Gastroenterol 2017; 23(30): 5499-5507
- URL: https://www.wjgnet.com/1007-9327/full/v23/i30/5499.htm
- DOI: https://dx.doi.org/10.3748/wjg.v23.i30.5499


