Copyright
©The Author(s) 2017.
World J Gastroenterol. Aug 14, 2017; 23(30): 5499-5507
Published online Aug 14, 2017. doi: 10.3748/wjg.v23.i30.5499
Published online Aug 14, 2017. doi: 10.3748/wjg.v23.i30.5499
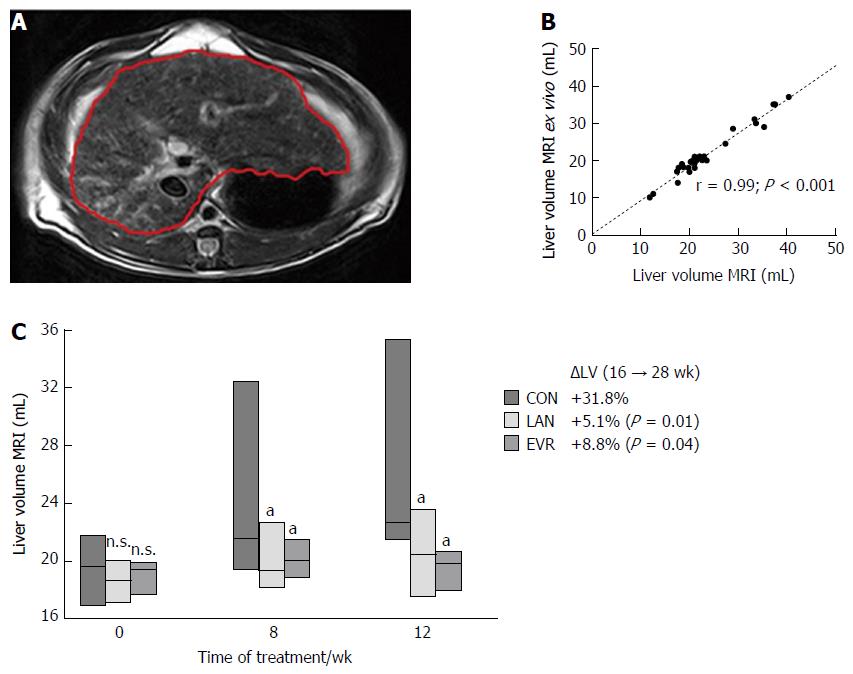
Figure 2 Liver volume measurements.
A: Demonstration of liver volume measured by MRI on each liver-containing slice of T2 weighted images. The liver margin is contoured manually with the red line; B: Correlation between liver volume calculated from MRI scan and liver volume measured ex vivo. Pearson correlation (r) is given together with significance; C: Liver volume (mean ± SE) determined by MRI for the different groups: CON (controls, n = 14), LAN (n = 10) and EVR (n = 7), measured at start of treatment, and after 8 and 12 wk. aP < 0.05 vs animals in control group at corresponding time, NS: Not significant, vs control. The percentual change in LV (ΔLV) over the 12 wk experimental period is shown together with the P value vs control group. LAN: Lanreotide; EVR: Everolimus.
- Citation: Temmerman F, Chen F, Libbrecht L, Vander Elst I, Windmolders P, Feng Y, Ni Y, De Smedt H, Nevens F, van Pelt J. Everolimus halts hepatic cystogenesis in a rodent model of polycystic-liver-disease. World J Gastroenterol 2017; 23(30): 5499-5507
- URL: https://www.wjgnet.com/1007-9327/full/v23/i30/5499.htm
- DOI: https://dx.doi.org/10.3748/wjg.v23.i30.5499


