Copyright
©The Author(s) 2017.
World J Gastroenterol. Aug 7, 2017; 23(29): 5379-5385
Published online Aug 7, 2017. doi: 10.3748/wjg.v23.i29.5379
Published online Aug 7, 2017. doi: 10.3748/wjg.v23.i29.5379
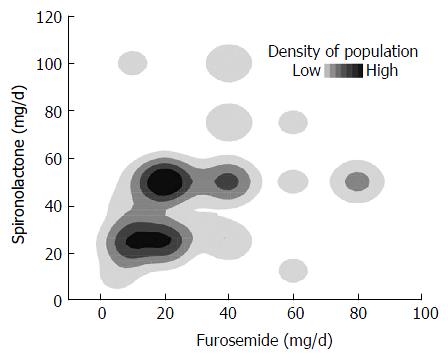
Figure 4 Individual doses of furosemide and spironolactone were plotted.
The area of the black-to-white gradation shows the population density. When the total amount of natriuretic diuretics, it was mainly controlled by the dose of furosemide.
- Citation: Miyazaki M, Yada M, Tanaka K, Senjyu T, Goya T, Motomura K, Kohjima M, Kato M, Masumoto A, Kotoh K. Efficacy of tolvaptan for the patients with advanced hepatocellular carcinoma. World J Gastroenterol 2017; 23(29): 5379-5385
- URL: https://www.wjgnet.com/1007-9327/full/v23/i29/5379.htm
- DOI: https://dx.doi.org/10.3748/wjg.v23.i29.5379


