Copyright
©The Author(s) 2017.
World J Gastroenterol. Jul 28, 2017; 23(28): 5127-5145
Published online Jul 28, 2017. doi: 10.3748/wjg.v23.i28.5127
Published online Jul 28, 2017. doi: 10.3748/wjg.v23.i28.5127
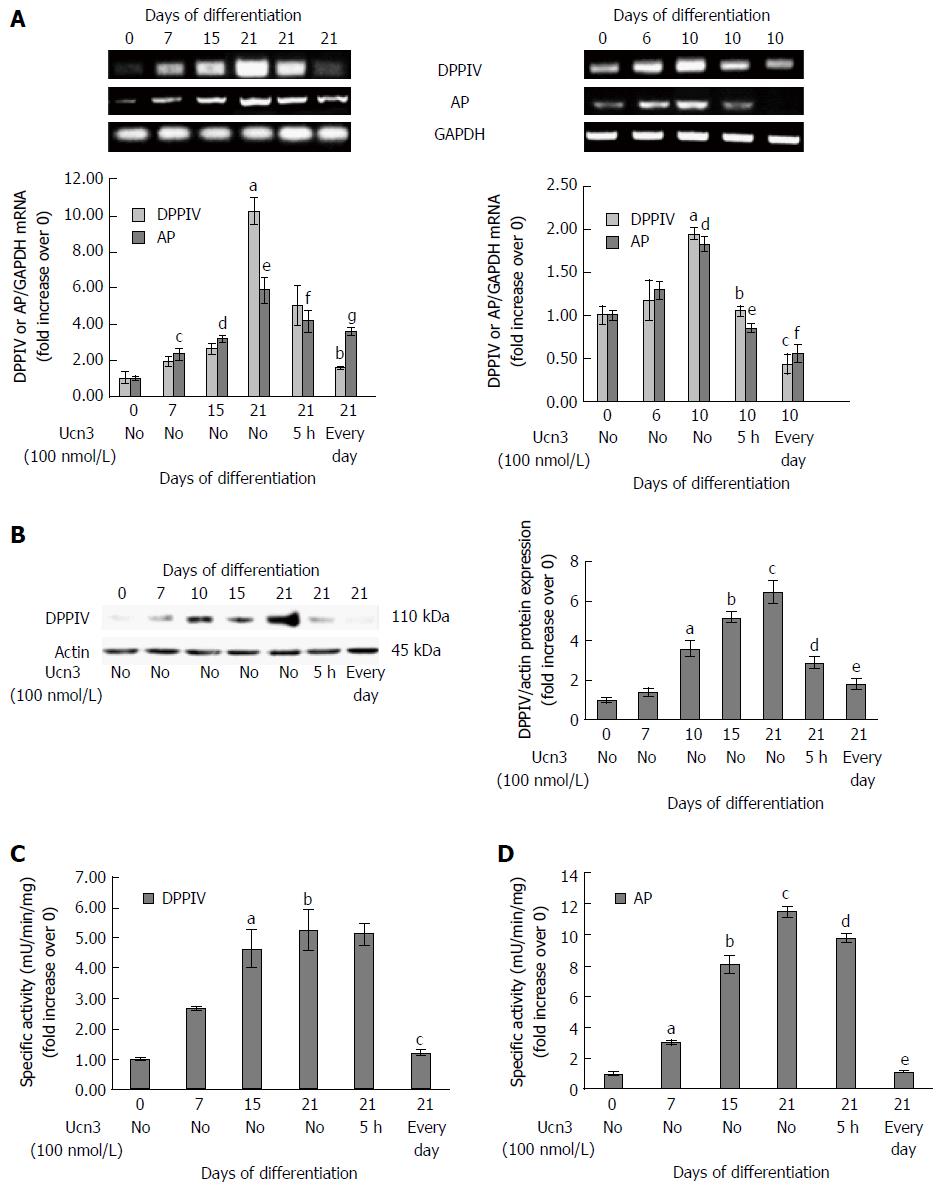
Figure 6 Corticotropin releasing factor receptor 2 signaling alters expression of characteristic markers of enterocyte differentiation.
A: Right panel: Detection of DPPIV and AP mRNA expression by RT-PCR during the kinetic of Caco-2 cell differentiation and after acute (5 h) or chronic (every day) exposure to 100 nmol/L Ucn3 of 21 d differentiated cells. GAPDH served as a housekeeping control. Quantification of KLF4 and AP mRNA from RT-PCR assays (lower panel). Data were expressed as fold increase of KLF4 or AP/GAPDH mRNA levels of differentiated (D7, D15, D21) vs undifferentiated cells (D0). Data represents means of three different experiments ± SEM. a,cP < 0.01 vs undifferentiated Caco-2 cells (D0), d,eP < 0.001 vs D0, bP < 0.05 vs differentiated Caco-2 cells (D21), fP < 0.01 vs D21, gP < 0.001 vs D21; Note that normality of distribution was not respected for DPPIV PCR. Left panel: Detection of DPPIV and AP mRNA expression by RT-PCR during the kinetic of HT-29 cell differentiation and after acute (5 h) or chronic (every day) exposure to 100 nmol/L Ucn3 of 10 d differentiated cells. GAPDH served as a housekeeping control. Quantification of DPPIV and AP mRNA from RT-PCR assays (lower panel). Data were expressed as fold increase of DPPIV and AP/GAPDH mRNA levels of differentiated (D6 and D10) vs undifferentiated cells (D0). Data represents means of three different experiments ± SEM. Data represents means of three different experiments ± SEM. a,dP < 0.01 vs undifferentiated HT-29 cells (D0); bP < 0.01 vs early differentiated HT-29 cells (D10), c,e,fP < 0.001 vs D10; B: Left panel: Detection of DPPIV protein expression by western blot during the kinetic of Caco-2 cell differentiation and after acute (5 h) or chronic (every day) exposure to 100 nmol/L Ucn3 of 21 d differentiated cells. Actin served as a loading control. Right panel: Quantification of DPPIV protein levels from western blot analysis. Data were expressed as fold increase of DPPIV/actin protein levels of differentiated (D7, D15, D21) vs undifferentiated cells (D0). Data represents means of three different experiments ± SEM. aP < 0.01 vs undifferentiated Caco-2 cells (D0), b,cP < 0.001 vs D0, dP < 0.01 vs differentiated Caco-2 cells (D21), eP < 0.001 vs D21. C and D: Detection of DPPIV (C) and AP (D) enzymatic activities during the kinetic of Caco-2 cell differentiation and after acute (5 h) or chronic (every day) exposure to 100 nmol/L Ucn3 of 21 d differentiated cells. Data were expressed as fold increase of enzymatic activities of differentiated (D7, D15, D21) vs undifferentiated cells (D0). Data represents means of three different experiments ± SEM. For C: a,bP < 0.001 vs undifferentiated Caco-2 cells (D0); cP < 0.01 vs differentiated Caco-2 cells (D21). For D: aP < 0.05 vs undifferentiated Caco-2 cells (D0), b,cP < 0.001 vs D0, dP < 0.05 vs differentiated Caco-2 cells (D21) and eP < 0.001 vs D21.
- Citation: Ducarouge B, Pelissier-Rota M, Powell R, Buisson A, Bonaz B, Jacquier-Sarlin M. Involvement of CRF2 signaling in enterocyte differentiation. World J Gastroenterol 2017; 23(28): 5127-5145
- URL: https://www.wjgnet.com/1007-9327/full/v23/i28/5127.htm
- DOI: https://dx.doi.org/10.3748/wjg.v23.i28.5127


