Copyright
©The Author(s) 2017.
World J Gastroenterol. Jul 28, 2017; 23(28): 5127-5145
Published online Jul 28, 2017. doi: 10.3748/wjg.v23.i28.5127
Published online Jul 28, 2017. doi: 10.3748/wjg.v23.i28.5127
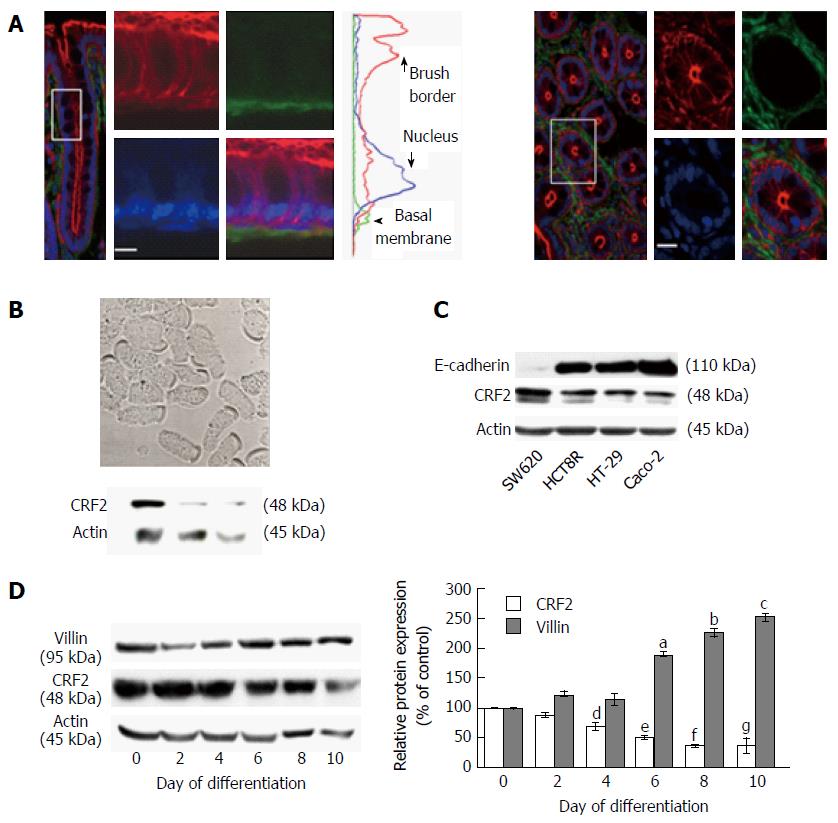
Figure 1 Corticotropin releasing factor receptor 2 expression in colonic epithelial cells.
A: Confocal microscopy analysis of CRF2 protein expression (green) in Sprague-Dawley rat proximal colon. Actin and nuclei are labeled by phaloïdin-TRITC (red) and Topro-3 (blue). Longitudinal profile (left panel) and transversal profile (right panel) showing the crypts. Scale bar, 5 μm. Middle curves represent the means of fluorescence were measured according the basal-apical axis of epithelial cells. Acquisitions were performed on a Leica TCS SPE confocal microscope (objective × 100); B: Upper panel: Phase contrast analysis of dissociated epithelial cells from proximal colon of Sprague-Dawley rats. Scale bar, 5 μm. Lower panel: western blot detection of CRF2 expression in lysates of dissociated epithelial cells from three different animals; C: Detection of E-cadherin and CRF2 protein expression by western blot in various human colon carcinoma cell lines. Actin served as a loading control; D: Left panel: Detection of CRF2 and villin protein expression by western blot according to the kinetic of HT-29 cell differentiation. Actin served as a loading control. Right panel: Quantification of CRF2 and villin protein levels from western blot analysis. Data were expressed as fold increase of CRF2 or villin/actin protein levels of differentiated (D2, D4, D6, D8 and D10) vs undifferentiated cells (D0). Data represents means of three different experiments ± SEM, a,b,c,e,fP < 0.001 vs undifferentiated HT-29 cells (D0), d,gP < 0.01 vs D0. CRF2: Corticotropin releasing factor receptor 2.
- Citation: Ducarouge B, Pelissier-Rota M, Powell R, Buisson A, Bonaz B, Jacquier-Sarlin M. Involvement of CRF2 signaling in enterocyte differentiation. World J Gastroenterol 2017; 23(28): 5127-5145
- URL: https://www.wjgnet.com/1007-9327/full/v23/i28/5127.htm
- DOI: https://dx.doi.org/10.3748/wjg.v23.i28.5127


