Copyright
©The Author(s) 2017.
World J Gastroenterol. Jul 7, 2017; 23(25): 4569-4578
Published online Jul 7, 2017. doi: 10.3748/wjg.v23.i25.4569
Published online Jul 7, 2017. doi: 10.3748/wjg.v23.i25.4569
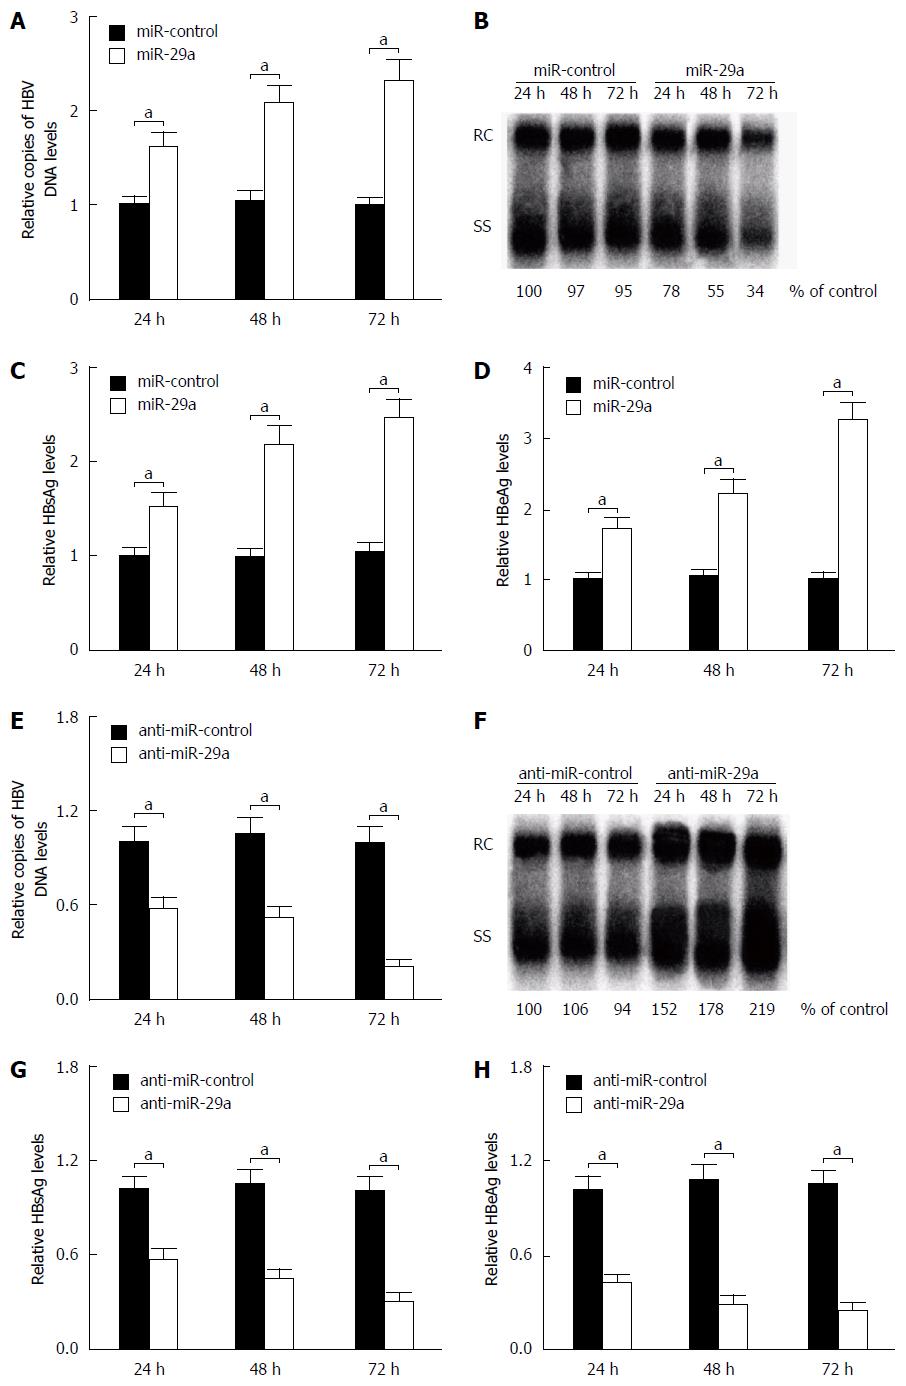
Figure 2 Effect of miR-29a on hepatitis B virus replication and expression (n = 3).
HepG2.2.15 cells were transfected with miR-control, miR-29a mimics or anti-miR-29a for 24 h. A: Relative HBV DNA copies were measured by qPCR analysis; B: HBV replication was detected by Southern blotting. The positions of relaxed circular (RC) and single-stranded (SS) DNAs are indicated 24 h post transfection. The ELISA assay was conducted to detect the levels of (C) HBsAg and (D) HBeAg 24 h post transfection. Data represent the mean ± SD. aP < 0.05 vs miR-control. HBV: Hepatitis B virus; HBsAg: Hepatitis B surface antigen; HBeAg: Hepatitis B e antigen.
- Citation: Wu HJ, Zhuo Y, Zhou YC, Wang XW, Wang YP, Si CY, Wang XH. miR-29a promotes hepatitis B virus replication and expression by targeting SMARCE1 in hepatoma carcinoma. World J Gastroenterol 2017; 23(25): 4569-4578
- URL: https://www.wjgnet.com/1007-9327/full/v23/i25/4569.htm
- DOI: https://dx.doi.org/10.3748/wjg.v23.i25.4569


