Copyright
©The Author(s) 2017.
World J Gastroenterol. Jul 7, 2017; 23(25): 4569-4578
Published online Jul 7, 2017. doi: 10.3748/wjg.v23.i25.4569
Published online Jul 7, 2017. doi: 10.3748/wjg.v23.i25.4569
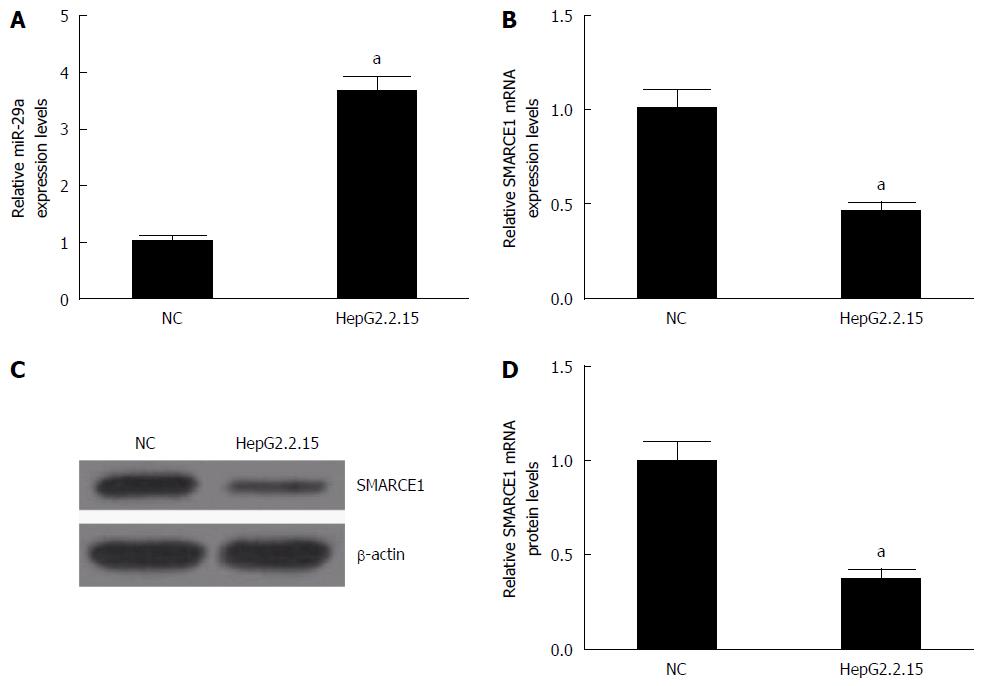
Figure 1 Expression of miR-29a and SMARCE1 in hepatitis B virus-infected HepG2.
2.15 cells (n = 3). A and B: qRT-PCR analysis showed the expression levels of miR-29a and SMARCE1 in HepG2.2.15 cells and HepG2 cells (NC); C and D: The protein level of SMARCE1 was detected and quantified by western blotting of HepG2.2.15 cells and HepG2 cells (NC). Data represent the mean ± SD. aP < 0.05 vs NC.
- Citation: Wu HJ, Zhuo Y, Zhou YC, Wang XW, Wang YP, Si CY, Wang XH. miR-29a promotes hepatitis B virus replication and expression by targeting SMARCE1 in hepatoma carcinoma. World J Gastroenterol 2017; 23(25): 4569-4578
- URL: https://www.wjgnet.com/1007-9327/full/v23/i25/4569.htm
- DOI: https://dx.doi.org/10.3748/wjg.v23.i25.4569


