Copyright
©The Author(s) 2017.
World J Gastroenterol. Jul 7, 2017; 23(25): 4517-4528
Published online Jul 7, 2017. doi: 10.3748/wjg.v23.i25.4517
Published online Jul 7, 2017. doi: 10.3748/wjg.v23.i25.4517
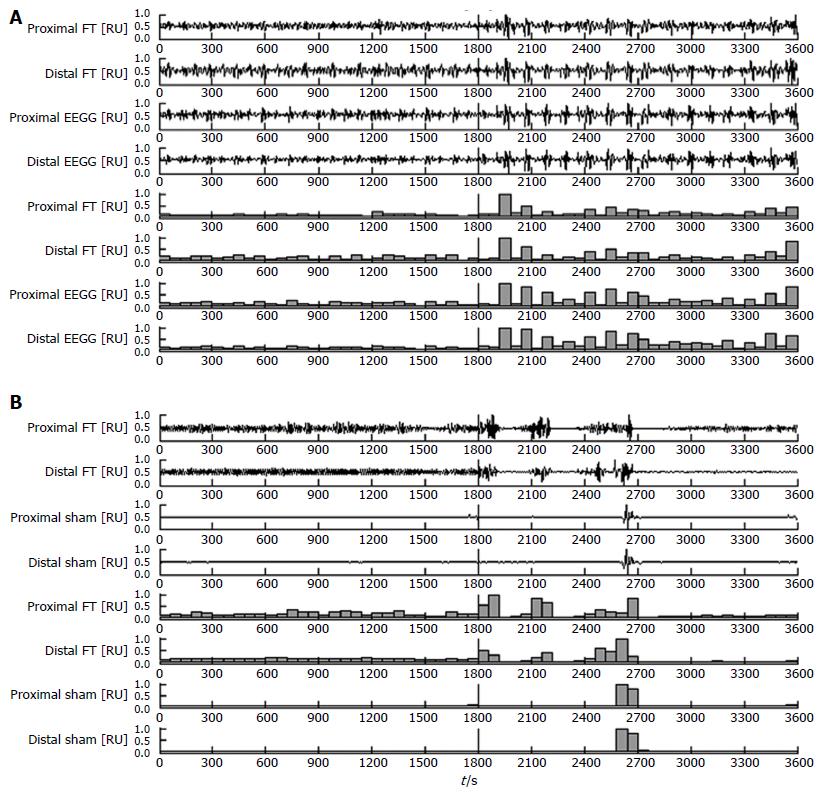
Figure 6 Combined plot of the raw signals and the one-minute motility indices for an active pill (A) and an inactive pill (B) in the baseline state (0-1800) and post-neostigmine administration (1800-3600).
A vertical line denotes the administration of neostigmine. Measurements are normalized and displayed in relative units (RU). EEGG: Enhanced electrogastrography; FT: Force transducer.
- Citation: Poscente MD, Mintchev MP. Enhanced electrogastrography: A realistic way to salvage a promise that was never kept? World J Gastroenterol 2017; 23(25): 4517-4528
- URL: https://www.wjgnet.com/1007-9327/full/v23/i25/4517.htm
- DOI: https://dx.doi.org/10.3748/wjg.v23.i25.4517


