Copyright
©The Author(s) 2017.
World J Gastroenterol. Jun 28, 2017; 23(24): 4422-4427
Published online Jun 28, 2017. doi: 10.3748/wjg.v23.i24.4422
Published online Jun 28, 2017. doi: 10.3748/wjg.v23.i24.4422
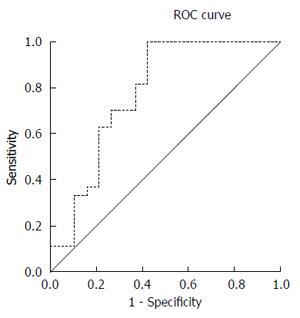
Figure 1 ROC curve shows that the area under the curve of procalcitionin level to distinguish upper or lower gastrointestinal perforation is 0.
778.
- Citation: Gao Y, Yu KJ, Kang K, Liu HT, Zhang X, Huang R, Qu JD, Wang SC, Liu RJ, Liu YS, Wang HL. Procalcitionin as a diagnostic marker to distinguish upper and lower gastrointestinal perforation. World J Gastroenterol 2017; 23(24): 4422-4427
- URL: https://www.wjgnet.com/1007-9327/full/v23/i24/4422.htm
- DOI: https://dx.doi.org/10.3748/wjg.v23.i24.4422


