Copyright
©The Author(s) 2017.
World J Gastroenterol. Jun 28, 2017; 23(24): 4341-4353
Published online Jun 28, 2017. doi: 10.3748/wjg.v23.i24.4341
Published online Jun 28, 2017. doi: 10.3748/wjg.v23.i24.4341
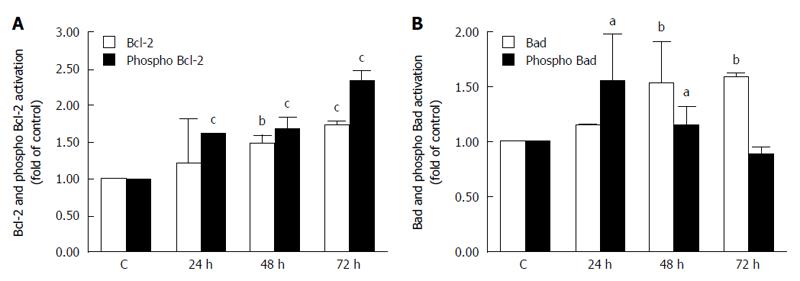
Figure 7 Analysis of mitochondrial apoptotic pathway associated proteins.
Relative levels and activation of Bcl-2 (A) or Bad (B) proteins after K-453 treatment. Significance: aP < 0.05, bP < 0.01, cP < 0.001 vs untreated cells (control).
- Citation: Tischlerova V, Kello M, Budovska M, Mojzis J. Indole phytoalexin derivatives induce mitochondrial-mediated apoptosis in human colorectal carcinoma cells. World J Gastroenterol 2017; 23(24): 4341-4353
- URL: https://www.wjgnet.com/1007-9327/full/v23/i24/4341.htm
- DOI: https://dx.doi.org/10.3748/wjg.v23.i24.4341


