Copyright
©The Author(s) 2017.
World J Gastroenterol. Jun 28, 2017; 23(24): 4341-4353
Published online Jun 28, 2017. doi: 10.3748/wjg.v23.i24.4341
Published online Jun 28, 2017. doi: 10.3748/wjg.v23.i24.4341
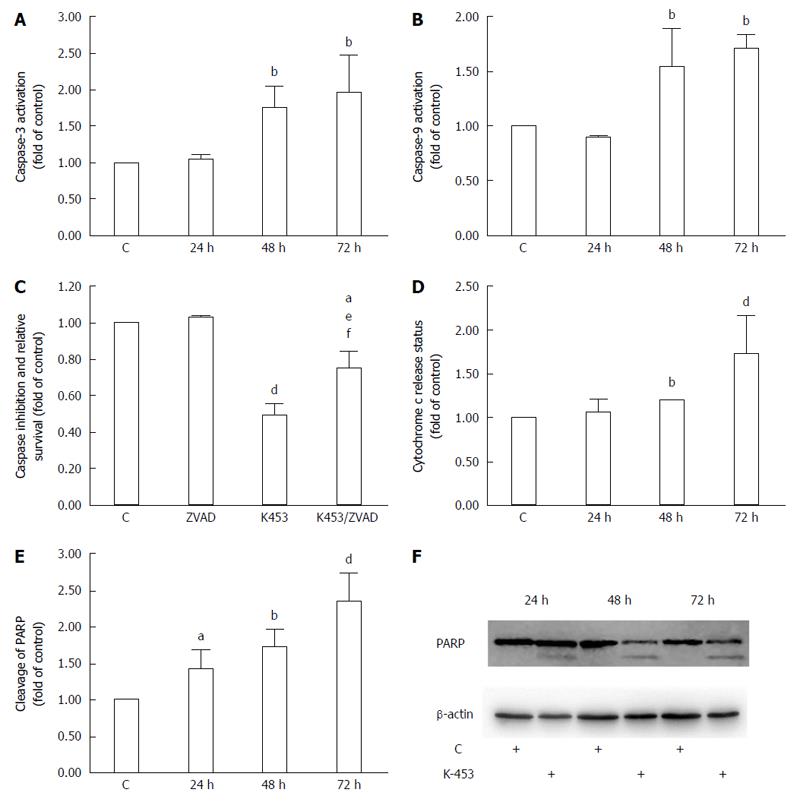
Figure 6 Effect of K-453 treatment on caspase activity and PARP cleavage.
A: Activation of caspase-3; B: caspase-9 evaluated by flow cytometric analysis in HCT116 cells 24, 48 and 72 h after treatment; C: Analysis of caspase inhibition evaluated by MTS after 72 h treatment; D: Release of cytochrome c evaluated by flow cytometric analysis in HCT116 cells 24, 48 and 72 h after treatment; E: Cleavage of PARP evaluated by flow cytometric analysis 24, 48 and 72 h after treatment. Data represents the mean ± SD compared to the control of 3 independent experiments; F: Cleavage of PARP evaluated by Western blot analysis. Significance: aP < 0.05, bP < 0.01, dP < 0.001 vs untreated cells (control); eP < 0.05 vs ZVAD; fP < 0.01 vs K453.
- Citation: Tischlerova V, Kello M, Budovska M, Mojzis J. Indole phytoalexin derivatives induce mitochondrial-mediated apoptosis in human colorectal carcinoma cells. World J Gastroenterol 2017; 23(24): 4341-4353
- URL: https://www.wjgnet.com/1007-9327/full/v23/i24/4341.htm
- DOI: https://dx.doi.org/10.3748/wjg.v23.i24.4341


