Copyright
©The Author(s) 2017.
World J Gastroenterol. Jun 21, 2017; 23(23): 4278-4284
Published online Jun 21, 2017. doi: 10.3748/wjg.v23.i23.4278
Published online Jun 21, 2017. doi: 10.3748/wjg.v23.i23.4278
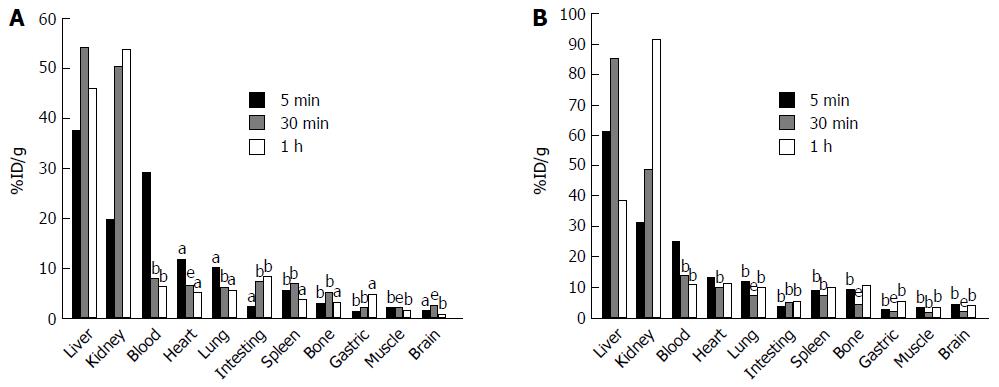
Figure 1 [18F]FNGA distribution in both control and fibrosis mice at various time points.
Relative radioactivity levels are shown at various time points from organs of control mice (n = 21) (A) and CCl4-induced fibrosis mice (n = 23) (B). bP < 0.01 vs Liver, aP < 0.05 vs Liver, eP < 0.001 vs Liver. [18F]FNGA: 18F-labeled neogalactosylalbumin.
- Citation: Du SD, Li SH, Jin B, Zhu ZH, Dang YH, Xing HQ, Li F, Wang XB, Lu X, Sang XT, Yang HY, Zhong SX, Mao YL. Potential application of neogalactosylalbumin in positron emission tomography evaluation of liver function. World J Gastroenterol 2017; 23(23): 4278-4284
- URL: https://www.wjgnet.com/1007-9327/full/v23/i23/4278.htm
- DOI: https://dx.doi.org/10.3748/wjg.v23.i23.4278


